Swiss vs Immigrants from Fiji Family Households with Children

COMPARE

Swiss
Race
Ancestry
AfghanAfricanAlaska NativeAlaskan AthabascanAlbanianAleutAlsatianAmericanApacheArabArapahoArgentineanArmenianAssyrian/Chaldean/SyriacAustralianAustrianBahamianBangladeshiBarbadianBasqueBelgianBelizeanBermudanBhutaneseBlackfeetBolivianBrazilianBritishBritish West IndianBulgarianBurmeseCajunCambodianCanadianCape VerdeanCarpatho RusynCelticCentral AmericanCentral American IndianCherokeeCheyenneChickasawChileanChineseChippewaChoctawColombianColvilleComancheCosta RicanCreeCreekCroatianCrowCubanCypriotCzechCzechoslovakianDanishDelawareDominicanDutchDutch West IndianEastern EuropeanEcuadorianEgyptianEnglishEstonianEthiopianEuropeanFijianFilipinoFinnishFrenchFrench American IndianFrench CanadianGermanGerman RussianGhanaianGreekGuamanian/ChamorroGuatemalanGuyaneseHaitianHmongHonduranHopiHoumaHungarianIcelanderIndian (Asian)IndonesianInupiatIranianIraqiIrishIroquoisIsraeliItalianJamaicanJapaneseJordanianKenyanKiowaKoreanLaotianLatvianLebaneseLiberianLithuanianLumbeeLuxembourgerMacedonianMalaysianMalteseMarshalleseMenomineeMexicanMexican American IndianMongolianMoroccanNative HawaiianNavajoNepaleseNew ZealanderNicaraguanNigerianNorthern EuropeanNorwegianOkinawanOsageOttawaPaiutePakistaniPalestinianPanamanianParaguayanPennsylvania GermanPeruvianPimaPolishPortuguesePotawatomiPuebloPuerto RicanPuget Sound SalishRomanianRussianSalvadoranSamoanScandinavianScotch-IrishScottishSeminoleSenegaleseSerbianShoshoneSierra LeoneanSiouxSlavicSlovakSloveneSomaliSouth AfricanSouth AmericanSouth American IndianSoviet UnionSpaniardSpanishSpanish AmericanSpanish American IndianSri LankanSubsaharan AfricanSudaneseSwedishSwissSyrianTaiwaneseThaiTlingit-HaidaTohono O'OdhamTonganTrinidadian and TobagonianTsimshianTurkishU.S. Virgin IslanderUgandanUkrainianUruguayanUteVenezuelanVietnameseWelshWest IndianYakamaYaquiYugoslavianYumanYup'ikZimbabwean
Immigration
NonimmigrantsImmigrantsAfghanistanAfricaAlbaniaArgentinaArmeniaAsiaAustraliaAustriaBahamasBangladeshBarbadosBelarusBelgiumBelizeBoliviaBosnia and HerzegovinaBrazilBulgariaBurma/MyanmarCabo VerdeCambodiaCameroonCanadaCaribbeanCentral AmericaChileChinaColombiaCongoCosta RicaCroatiaCubaCzechoslovakiaDenmarkDominicaDominican RepublicEastern AfricaEastern AsiaEastern EuropeEcuadorEgyptEl SalvadorEnglandEritreaEthiopiaEuropeFranceGermanyGhanaGreeceGrenadaGuatemalaGuyanaHaitiHondurasHong KongHungaryIndiaIndonesiaIranIraqIrelandIsraelItalyJamaicaJapanJordanKazakhstanKenyaKoreaKuwaitLaosLatin AmericaLatviaLebanonLiberiaLithuaniaMalaysiaMexicoMicronesiaMiddle AfricaMoldovaMoroccoNepalNetherlandsNicaraguaNigeriaNorth AmericaNorth MacedoniaNorthern AfricaNorthern EuropeNorwayOceaniaPakistanPanamaPeruPhilippinesPolandPortugalRomaniaRussiaSaudi ArabiaScotlandSenegalSerbiaSierra LeoneSingaporeSomaliaSouth AfricaSouth AmericaSouth Central AsiaSouth Eastern AsiaSouthern EuropeSpainSri LankaSt. Vincent and the GrenadinesSudanSwedenSwitzerlandSyriaTaiwanThailandTrinidad and TobagoTurkeyUgandaUkraineUruguayUzbekistanVenezuelaVietnamWest IndiesWestern AfricaWestern AsiaWestern EuropeYemenZaireZimbabweAzores
Immigrants from Fiji
Race
Ancestry
AfghanAfricanAlaska NativeAlaskan AthabascanAlbanianAleutAlsatianAmericanApacheArabArapahoArgentineanArmenianAssyrian/Chaldean/SyriacAustralianAustrianBahamianBangladeshiBarbadianBasqueBelgianBelizeanBermudanBhutaneseBlackfeetBolivianBrazilianBritishBritish West IndianBulgarianBurmeseCajunCambodianCanadianCape VerdeanCarpatho RusynCelticCentral AmericanCentral American IndianCherokeeCheyenneChickasawChileanChineseChippewaChoctawColombianColvilleComancheCosta RicanCreeCreekCroatianCrowCubanCypriotCzechCzechoslovakianDanishDelawareDominicanDutchDutch West IndianEastern EuropeanEcuadorianEgyptianEnglishEstonianEthiopianEuropeanFijianFilipinoFinnishFrenchFrench American IndianFrench CanadianGermanGerman RussianGhanaianGreekGuamanian/ChamorroGuatemalanGuyaneseHaitianHmongHonduranHopiHoumaHungarianIcelanderIndian (Asian)IndonesianInupiatIranianIraqiIrishIroquoisIsraeliItalianJamaicanJapaneseJordanianKenyanKiowaKoreanLaotianLatvianLebaneseLiberianLithuanianLumbeeLuxembourgerMacedonianMalaysianMalteseMarshalleseMenomineeMexicanMexican American IndianMongolianMoroccanNative HawaiianNavajoNepaleseNew ZealanderNicaraguanNigerianNorthern EuropeanNorwegianOkinawanOsageOttawaPaiutePakistaniPalestinianPanamanianParaguayanPennsylvania GermanPeruvianPimaPolishPortuguesePotawatomiPuebloPuerto RicanPuget Sound SalishRomanianRussianSalvadoranSamoanScandinavianScotch-IrishScottishSeminoleSenegaleseSerbianShoshoneSierra LeoneanSiouxSlavicSlovakSloveneSomaliSouth AfricanSouth AmericanSouth American IndianSoviet UnionSpaniardSpanishSpanish AmericanSpanish American IndianSri LankanSubsaharan AfricanSudaneseSwedishSyrianTaiwaneseThaiTlingit-HaidaTohono O'OdhamTonganTrinidadian and TobagonianTsimshianTurkishU.S. Virgin IslanderUgandanUkrainianUruguayanUteVenezuelanVietnameseWelshWest IndianYakamaYaquiYugoslavianYumanYup'ikZimbabwean
Immigration
NonimmigrantsImmigrantsAfghanistanAfricaAlbaniaArgentinaArmeniaAsiaAustraliaAustriaBahamasBangladeshBarbadosBelarusBelgiumBelizeBoliviaBosnia and HerzegovinaBrazilBulgariaBurma/MyanmarCabo VerdeCambodiaCameroonCanadaCaribbeanCentral AmericaChileChinaColombiaCongoCosta RicaCroatiaCubaCzechoslovakiaDenmarkDominicaDominican RepublicEastern AfricaEastern AsiaEastern EuropeEcuadorEgyptEl SalvadorEnglandEritreaEthiopiaEuropeFijiFranceGermanyGhanaGreeceGrenadaGuatemalaGuyanaHaitiHondurasHong KongHungaryIndiaIndonesiaIranIraqIrelandIsraelItalyJamaicaJapanJordanKazakhstanKenyaKoreaKuwaitLaosLatin AmericaLatviaLebanonLiberiaLithuaniaMalaysiaMexicoMicronesiaMiddle AfricaMoldovaMoroccoNepalNetherlandsNicaraguaNigeriaNorth AmericaNorth MacedoniaNorthern AfricaNorthern EuropeNorwayOceaniaPakistanPanamaPeruPhilippinesPolandPortugalRomaniaRussiaSaudi ArabiaScotlandSenegalSerbiaSierra LeoneSingaporeSomaliaSouth AfricaSouth AmericaSouth Central AsiaSouth Eastern AsiaSouthern EuropeSpainSri LankaSt. Vincent and the GrenadinesSudanSwedenSwitzerlandSyriaTaiwanThailandTrinidad and TobagoTurkeyUgandaUkraineUruguayUzbekistanVenezuelaVietnamWest IndiesWestern AfricaWestern AsiaWestern EuropeYemenZaireZimbabweAzores
Family Households with Children
Income
Poverty
Unemployment
Labor Participation
Family Structure
Vehicle Availability
Education Level
Disability

Family Households with Children Comparison

Swiss

Immigrants from Fiji

Excellent
Exceptional
27.7%
FAMILY HOUSEHOLDS WITH CHILDREN
81.4/ 100
METRIC RATING
142nd/ 347
METRIC RANK
30.5%
FAMILY HOUSEHOLDS WITH CHILDREN
100.0/ 100
METRIC RATING
10th/ 347
METRIC RANK

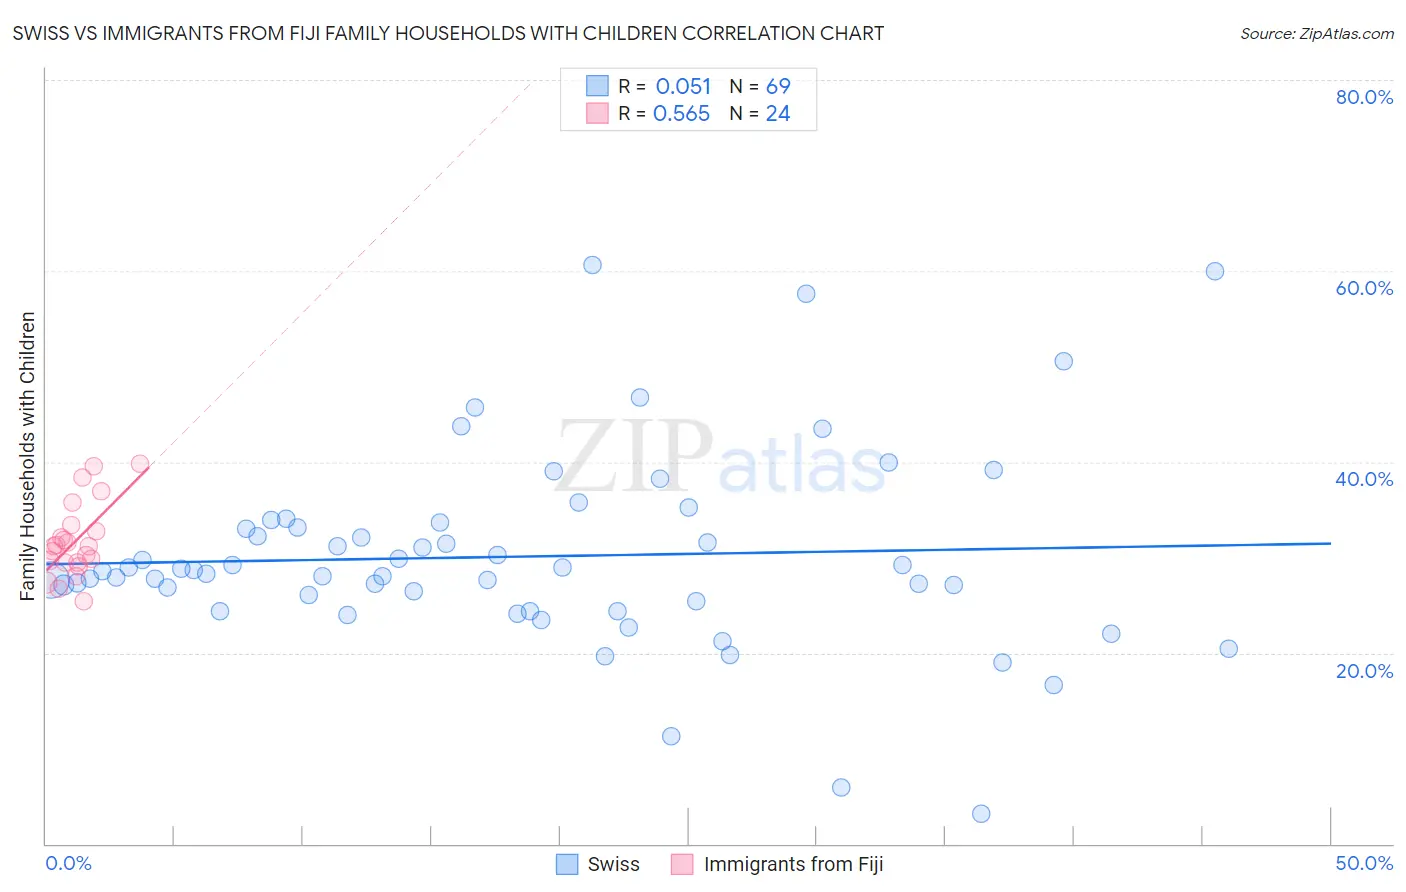
Swiss vs Immigrants from Fiji Family Households with Children Correlation Chart

The statistical analysis conducted on geographies consisting of 464,540,276 people shows a slight positive correlation between the proportion of Swiss and percentage of family households with children in the United States with a correlation coefficient (R) of 0.051 and weighted average of 27.7%. Similarly, the statistical analysis conducted on geographies consisting of 93,754,712 people shows a substantial positive correlation between the proportion of Immigrants from Fiji and percentage of family households with children in the United States with a correlation coefficient (R) of 0.565 and weighted average of 30.5%, a difference of 10.4%.
Swiss vs Immigrants from Fiji Family Households with Children

Family Households with Children Correlation Summary

MeasurementSwissImmigrants from Fiji
Minimum3.1%25.4%
Maximum60.6%39.8%
Range57.5%14.4%
Mean30.1%31.7%
Median28.5%31.2%
Interquartile 25% (IQ1)24.9%29.4%
Interquartile 75% (IQ3)33.4%33.1%
Interquartile Range (IQR)8.6%3.6%
Standard Deviation (Sample)10.3%3.9%
Standard Deviation (Population)10.2%3.8%

Similar Demographics by Family Households with Children

Demographics Similar to Swiss by Family Households with Children

In terms of family households with children, the demographic groups most similar to Swiss are Immigrants from Eastern Asia (27.7%, a difference of 0.010%), Spanish (27.7%, a difference of 0.020%), Vietnamese (27.7%, a difference of 0.040%), Immigrants from Eastern Africa (27.7%, a difference of 0.040%), and Brazilian (27.7%, a difference of 0.060%).
DemographicsRating | RankFamily Households with Children
Immigrants | Ecuador
84.6
/100
|
#135
Excellent
27.7%
Immigrants | Portugal
84.1
/100
|
#136
Excellent
27.7%
Immigrants | Dominican Republic
83.9
/100
|
#137
Excellent
27.7%
Uruguayans
83.2
/100
|
#138
Excellent
27.7%
Vietnamese
82.6
/100
|
#139
Excellent
27.7%
Spanish
81.8
/100
|
#140
Excellent
27.7%
Immigrants | Eastern Asia
81.7
/100
|
#141
Excellent
27.7%
Swiss
81.4
/100
|
#142
Excellent
27.7%
Immigrants | Eastern Africa
80.2
/100
|
#143
Excellent
27.7%
Brazilians
79.6
/100
|
#144
Good
27.7%
Immigrants | Chile
79.5
/100
|
#145
Good
27.7%
Basques
79.5
/100
|
#146
Good
27.7%
Immigrants | Moldova
79.1
/100
|
#147
Good
27.6%
Osage
79.0
/100
|
#148
Good
27.6%
Menominee
78.9
/100
|
#149
Good
27.6%

Demographics Similar to Immigrants from Fiji by Family Households with Children

In terms of family households with children, the demographic groups most similar to Immigrants from Fiji are Nepalese (30.5%, a difference of 0.080%), Thai (30.6%, a difference of 0.32%), Yakama (30.8%, a difference of 0.80%), Immigrants from Pakistan (30.2%, a difference of 0.96%), and Afghan (30.2%, a difference of 1.2%).
DemographicsRating | RankFamily Households with Children
Immigrants | Mexico
100.0
/100
|
#3
Exceptional
31.6%
Mexicans
100.0
/100
|
#4
Exceptional
31.4%
Tongans
100.0
/100
|
#5
Exceptional
31.2%
Immigrants | India
100.0
/100
|
#6
Exceptional
31.0%
Immigrants | Central America
100.0
/100
|
#7
Exceptional
31.0%
Yakama
100.0
/100
|
#8
Exceptional
30.8%
Thais
100.0
/100
|
#9
Exceptional
30.6%
Immigrants | Fiji
100.0
/100
|
#10
Exceptional
30.5%
Nepalese
100.0
/100
|
#11
Exceptional
30.5%
Immigrants | Pakistan
100.0
/100
|
#12
Exceptional
30.2%
Afghans
100.0
/100
|
#13
Exceptional
30.2%
Bangladeshis
100.0
/100
|
#14
Exceptional
30.1%
Immigrants | South Central Asia
100.0
/100
|
#15
Exceptional
30.0%
Immigrants | Afghanistan
100.0
/100
|
#16
Exceptional
30.0%
Hispanics or Latinos
100.0
/100
|
#17
Exceptional
29.9%