Swiss vs Immigrants from Cuba Single Mother Households
COMPARE
Swiss
Immigrants from Cuba
Single Mother Households
Single Mother Households Comparison
Swiss
Immigrants from Cuba
5.6%
SINGLE MOTHER HOUSEHOLDS
98.1/ 100
METRIC RATING
78th/ 347
METRIC RANK
7.5%
SINGLE MOTHER HOUSEHOLDS
0.1/ 100
METRIC RATING
270th/ 347
METRIC RANK
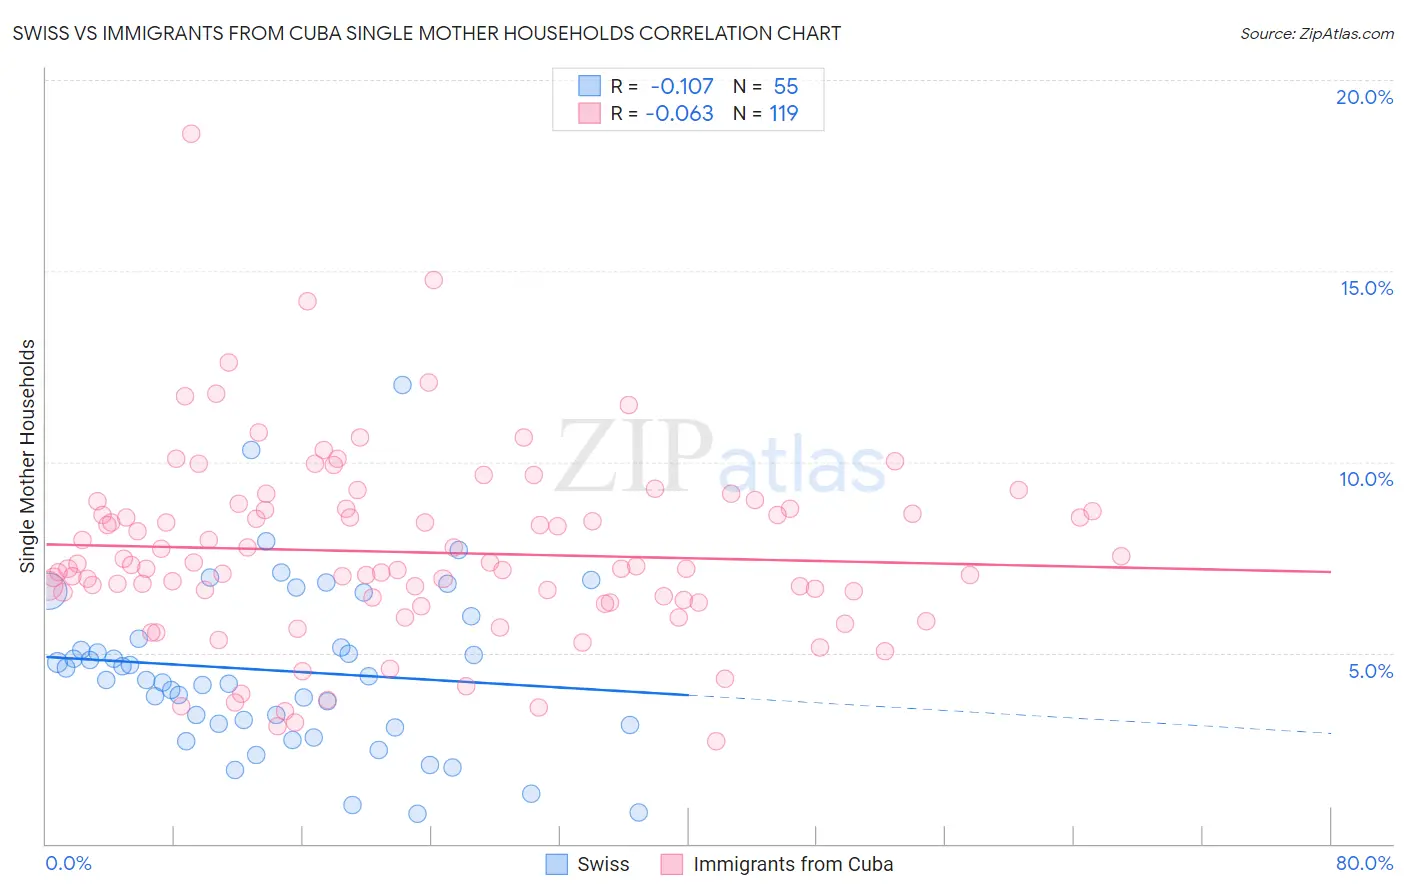
Swiss vs Immigrants from Cuba Single Mother Households Correlation Chart
The statistical analysis conducted on geographies consisting of 462,653,045 people shows a poor negative correlation between the proportion of Swiss and percentage of single mother households in the United States with a correlation coefficient (R) of -0.107 and weighted average of 5.6%. Similarly, the statistical analysis conducted on geographies consisting of 325,295,846 people shows a slight negative correlation between the proportion of Immigrants from Cuba and percentage of single mother households in the United States with a correlation coefficient (R) of -0.063 and weighted average of 7.5%, a difference of 33.7%.
Single Mother Households Correlation Summary
| Measurement | Swiss | Immigrants from Cuba |
| Minimum | 0.79% | 2.7% |
| Maximum | 12.0% | 18.6% |
| Range | 11.2% | 15.9% |
| Mean | 4.5% | 7.6% |
| Median | 4.3% | 7.2% |
| Interquartile 25% (IQ1) | 3.1% | 6.4% |
| Interquartile 75% (IQ3) | 5.4% | 8.8% |
| Interquartile Range (IQR) | 2.2% | 2.4% |
| Standard Deviation (Sample) | 2.2% | 2.4% |
| Standard Deviation (Population) | 2.2% | 2.4% |
Similar Demographics by Single Mother Households
Demographics Similar to Swiss by Single Mother Households
In terms of single mother households, the demographic groups most similar to Swiss are Romanian (5.6%, a difference of 0.0%), New Zealander (5.6%, a difference of 0.19%), Immigrants from Sri Lanka (5.6%, a difference of 0.20%), Slovene (5.6%, a difference of 0.26%), and Czech (5.6%, a difference of 0.31%).
| Demographics | Rating | Rank | Single Mother Households |
| Immigrants | Kazakhstan | 98.4 /100 | #71 | Exceptional 5.6% |
| Immigrants | Netherlands | 98.4 /100 | #72 | Exceptional 5.6% |
| Immigrants | Asia | 98.4 /100 | #73 | Exceptional 5.6% |
| Immigrants | North America | 98.3 /100 | #74 | Exceptional 5.6% |
| Slovenes | 98.3 /100 | #75 | Exceptional 5.6% |
| New Zealanders | 98.2 /100 | #76 | Exceptional 5.6% |
| Romanians | 98.1 /100 | #77 | Exceptional 5.6% |
| Swiss | 98.1 /100 | #78 | Exceptional 5.6% |
| Immigrants | Sri Lanka | 98.0 /100 | #79 | Exceptional 5.6% |
| Czechs | 97.9 /100 | #80 | Exceptional 5.6% |
| Immigrants | Moldova | 97.9 /100 | #81 | Exceptional 5.6% |
| Immigrants | Malaysia | 97.8 /100 | #82 | Exceptional 5.7% |
| Immigrants | Hungary | 97.8 /100 | #83 | Exceptional 5.7% |
| Carpatho Rusyns | 97.7 /100 | #84 | Exceptional 5.7% |
| Hungarians | 97.6 /100 | #85 | Exceptional 5.7% |
Demographics Similar to Immigrants from Cuba by Single Mother Households
In terms of single mother households, the demographic groups most similar to Immigrants from Cuba are Salvadoran (7.5%, a difference of 0.090%), Immigrants from the Azores (7.5%, a difference of 0.090%), Somali (7.5%, a difference of 0.16%), Belizean (7.6%, a difference of 0.40%), and Immigrants from Guyana (7.6%, a difference of 0.45%).
| Demographics | Rating | Rank | Single Mother Households |
| Immigrants | Nicaragua | 0.2 /100 | #263 | Tragic 7.4% |
| Yaqui | 0.1 /100 | #264 | Tragic 7.4% |
| Crow | 0.1 /100 | #265 | Tragic 7.4% |
| Nepalese | 0.1 /100 | #266 | Tragic 7.5% |
| Blackfeet | 0.1 /100 | #267 | Tragic 7.5% |
| Indonesians | 0.1 /100 | #268 | Tragic 7.5% |
| Somalis | 0.1 /100 | #269 | Tragic 7.5% |
| Immigrants | Cuba | 0.1 /100 | #270 | Tragic 7.5% |
| Salvadorans | 0.1 /100 | #271 | Tragic 7.5% |
| Immigrants | Azores | 0.1 /100 | #272 | Tragic 7.5% |
| Belizeans | 0.1 /100 | #273 | Tragic 7.6% |
| Immigrants | Guyana | 0.1 /100 | #274 | Tragic 7.6% |
| Central American Indians | 0.1 /100 | #275 | Tragic 7.6% |
| Guyanese | 0.1 /100 | #276 | Tragic 7.6% |
| Immigrants | Trinidad and Tobago | 0.1 /100 | #277 | Tragic 7.6% |