Swedish vs Panamanian Divorced or Separated
COMPARE
Swedish
Panamanian
Divorced or Separated
Divorced or Separated Comparison
Swedes
Panamanians
12.1%
DIVORCED OR SEPARATED
34.4/ 100
METRIC RATING
191st/ 347
METRIC RANK
12.7%
DIVORCED OR SEPARATED
0.3/ 100
METRIC RATING
271st/ 347
METRIC RANK
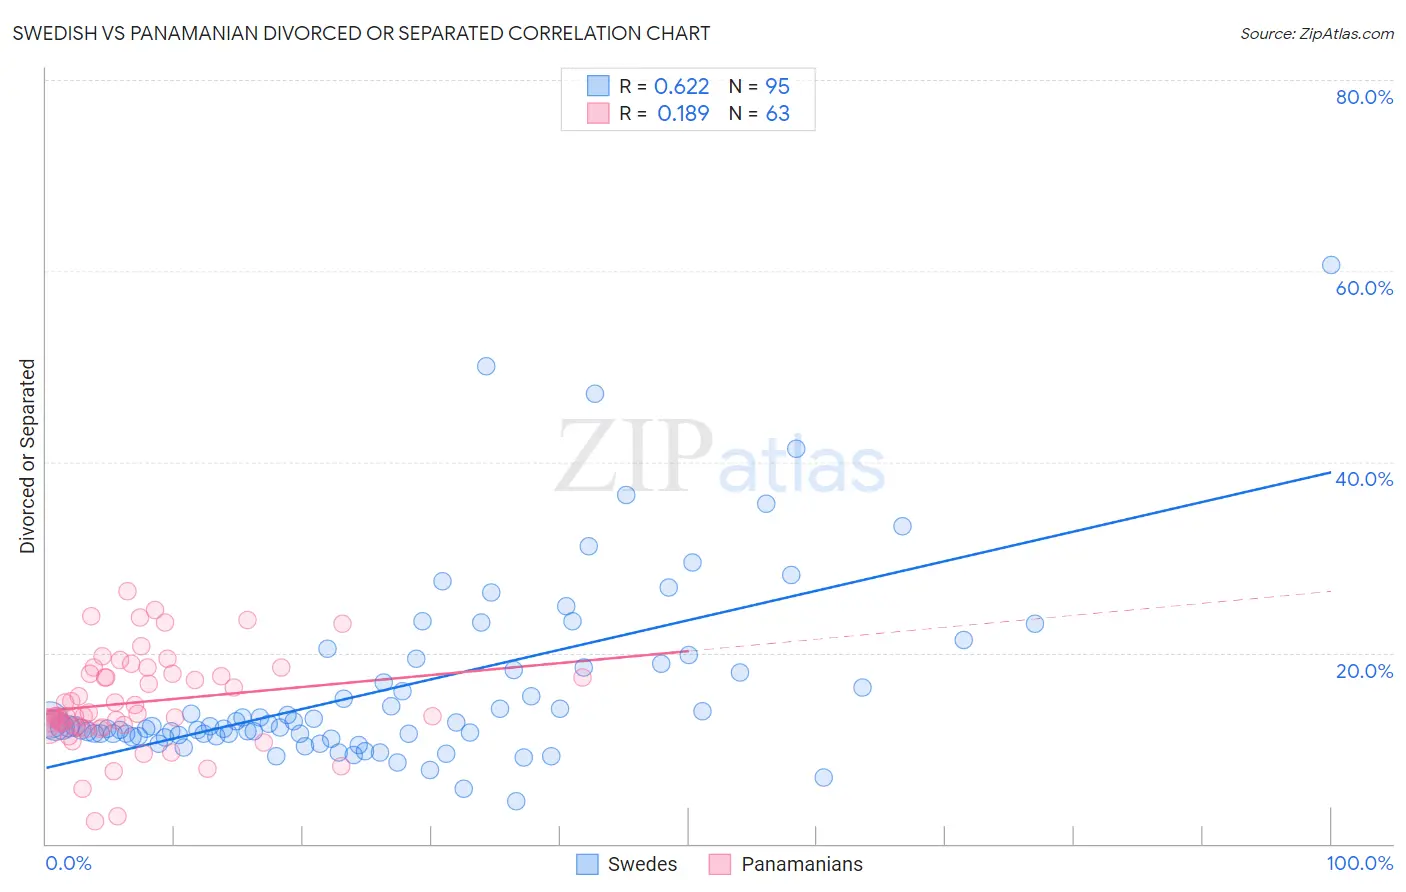
Swedish vs Panamanian Divorced or Separated Correlation Chart
The statistical analysis conducted on geographies consisting of 538,888,854 people shows a significant positive correlation between the proportion of Swedes and percentage of population currently divorced or separated in the United States with a correlation coefficient (R) of 0.622 and weighted average of 12.1%. Similarly, the statistical analysis conducted on geographies consisting of 281,170,767 people shows a poor positive correlation between the proportion of Panamanians and percentage of population currently divorced or separated in the United States with a correlation coefficient (R) of 0.189 and weighted average of 12.7%, a difference of 4.3%.
Divorced or Separated Correlation Summary
| Measurement | Swedish | Panamanian |
| Minimum | 4.5% | 2.3% |
| Maximum | 60.6% | 26.5% |
| Range | 56.1% | 24.2% |
| Mean | 16.3% | 14.8% |
| Median | 12.3% | 13.4% |
| Interquartile 25% (IQ1) | 11.4% | 12.3% |
| Interquartile 75% (IQ3) | 18.5% | 17.9% |
| Interquartile Range (IQR) | 7.2% | 5.6% |
| Standard Deviation (Sample) | 9.7% | 5.0% |
| Standard Deviation (Population) | 9.6% | 4.9% |
Similar Demographics by Divorced or Separated
Demographics Similar to Swedes by Divorced or Separated
In terms of divorced or separated, the demographic groups most similar to Swedes are Moroccan (12.1%, a difference of 0.020%), Sierra Leonean (12.1%, a difference of 0.040%), Norwegian (12.1%, a difference of 0.050%), Immigrants from Thailand (12.1%, a difference of 0.070%), and Immigrants from Eritrea (12.1%, a difference of 0.10%).
| Demographics | Rating | Rank | Divorced or Separated |
| Immigrants | North America | 41.1 /100 | #184 | Average 12.1% |
| Immigrants | Nigeria | 40.5 /100 | #185 | Average 12.1% |
| Immigrants | Chile | 39.0 /100 | #186 | Fair 12.1% |
| Belizeans | 37.7 /100 | #187 | Fair 12.1% |
| Immigrants | Belize | 37.6 /100 | #188 | Fair 12.1% |
| Sierra Leoneans | 35.5 /100 | #189 | Fair 12.1% |
| Moroccans | 34.8 /100 | #190 | Fair 12.1% |
| Swedes | 34.4 /100 | #191 | Fair 12.1% |
| Norwegians | 33.2 /100 | #192 | Fair 12.1% |
| Immigrants | Thailand | 32.5 /100 | #193 | Fair 12.1% |
| Immigrants | Eritrea | 31.9 /100 | #194 | Fair 12.1% |
| Immigrants | England | 31.4 /100 | #195 | Fair 12.1% |
| Immigrants | Burma/Myanmar | 30.4 /100 | #196 | Fair 12.1% |
| Immigrants | Africa | 30.3 /100 | #197 | Fair 12.1% |
| Nigerians | 30.1 /100 | #198 | Fair 12.1% |
Demographics Similar to Panamanians by Divorced or Separated
In terms of divorced or separated, the demographic groups most similar to Panamanians are Immigrants from Middle Africa (12.7%, a difference of 0.050%), Ute (12.6%, a difference of 0.060%), Immigrants from Micronesia (12.7%, a difference of 0.16%), Immigrants from Liberia (12.6%, a difference of 0.18%), and Bermudan (12.7%, a difference of 0.18%).
| Demographics | Rating | Rank | Divorced or Separated |
| English | 0.5 /100 | #264 | Tragic 12.6% |
| Immigrants | Senegal | 0.5 /100 | #265 | Tragic 12.6% |
| Whites/Caucasians | 0.5 /100 | #266 | Tragic 12.6% |
| Scottish | 0.4 /100 | #267 | Tragic 12.6% |
| Fijians | 0.4 /100 | #268 | Tragic 12.6% |
| Immigrants | Liberia | 0.4 /100 | #269 | Tragic 12.6% |
| Ute | 0.4 /100 | #270 | Tragic 12.6% |
| Panamanians | 0.3 /100 | #271 | Tragic 12.7% |
| Immigrants | Middle Africa | 0.3 /100 | #272 | Tragic 12.7% |
| Immigrants | Micronesia | 0.3 /100 | #273 | Tragic 12.7% |
| Bermudans | 0.3 /100 | #274 | Tragic 12.7% |
| Central American Indians | 0.3 /100 | #275 | Tragic 12.7% |
| Spaniards | 0.2 /100 | #276 | Tragic 12.7% |
| Dominicans | 0.2 /100 | #277 | Tragic 12.7% |
| Lumbee | 0.2 /100 | #278 | Tragic 12.7% |