Subsaharan African vs Syrian Currently Married
COMPARE
Subsaharan African
Syrian
Currently Married
Currently Married Comparison
Sub-Saharan Africans
Syrians
42.6%
CURRENTLY MARRIED
0.0/ 100
METRIC RATING
292nd/ 347
METRIC RANK
47.5%
CURRENTLY MARRIED
88.9/ 100
METRIC RATING
120th/ 347
METRIC RANK
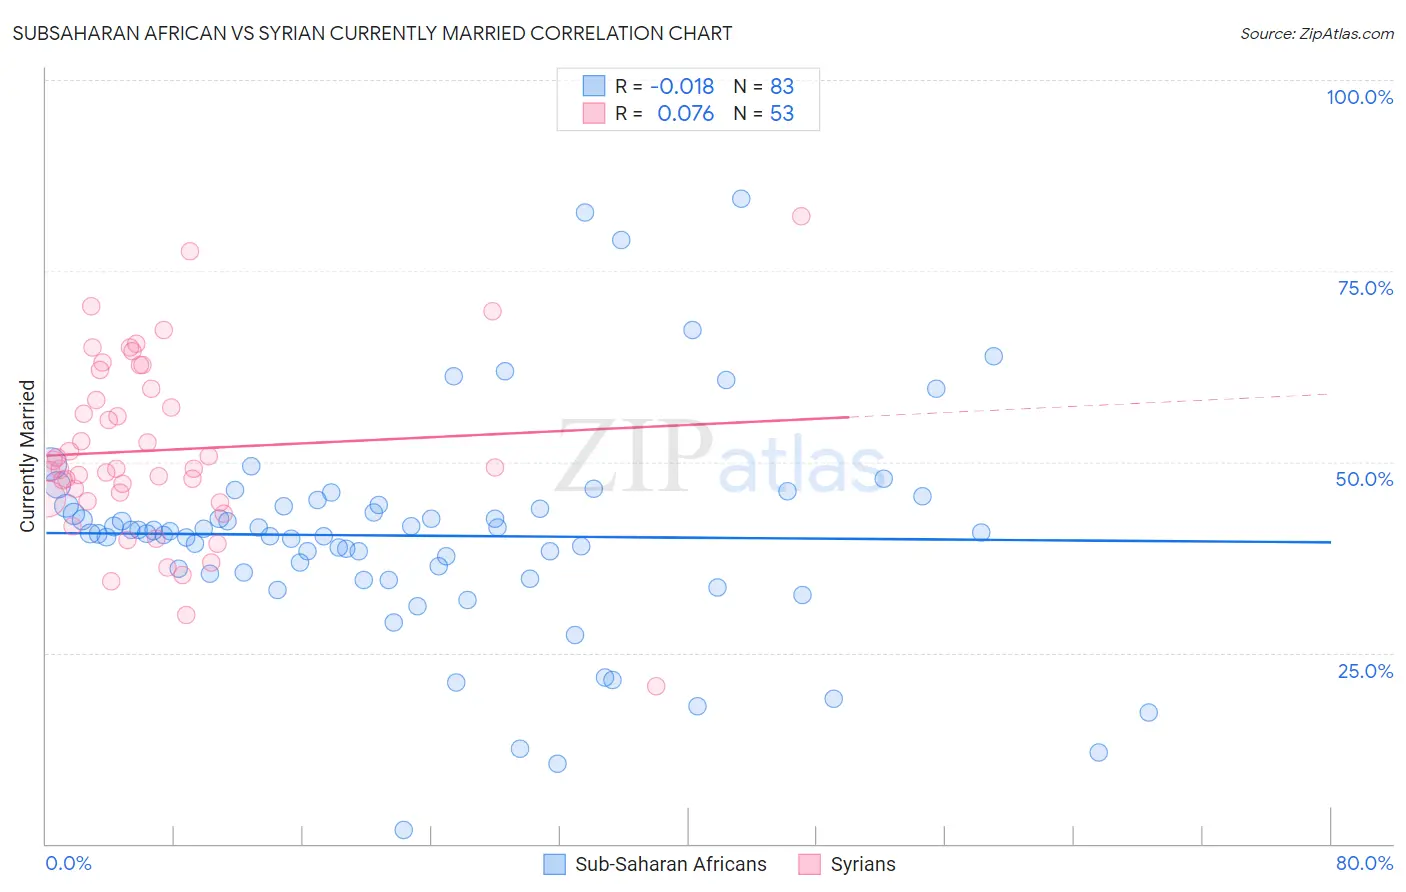
Subsaharan African vs Syrian Currently Married Correlation Chart
The statistical analysis conducted on geographies consisting of 508,112,533 people shows no correlation between the proportion of Sub-Saharan Africans and percentage of population currently married in the United States with a correlation coefficient (R) of -0.018 and weighted average of 42.6%. Similarly, the statistical analysis conducted on geographies consisting of 266,298,061 people shows a slight positive correlation between the proportion of Syrians and percentage of population currently married in the United States with a correlation coefficient (R) of 0.076 and weighted average of 47.5%, a difference of 11.6%.
Currently Married Correlation Summary
| Measurement | Subsaharan African | Syrian |
| Minimum | 1.8% | 20.6% |
| Maximum | 84.5% | 82.1% |
| Range | 82.7% | 61.5% |
| Mean | 40.3% | 51.6% |
| Median | 40.7% | 49.1% |
| Interquartile 25% (IQ1) | 35.4% | 45.0% |
| Interquartile 75% (IQ3) | 44.3% | 60.8% |
| Interquartile Range (IQR) | 8.9% | 15.7% |
| Standard Deviation (Sample) | 14.0% | 11.8% |
| Standard Deviation (Population) | 13.9% | 11.7% |
Similar Demographics by Currently Married
Demographics Similar to Sub-Saharan Africans by Currently Married
In terms of currently married, the demographic groups most similar to Sub-Saharan Africans are Yuman (42.6%, a difference of 0.020%), Honduran (42.5%, a difference of 0.14%), Immigrants from Guatemala (42.6%, a difference of 0.16%), Immigrants from Ghana (42.7%, a difference of 0.27%), and Paiute (42.7%, a difference of 0.28%).
| Demographics | Rating | Rank | Currently Married |
| Immigrants | Middle Africa | 0.0 /100 | #285 | Tragic 43.0% |
| Ghanaians | 0.0 /100 | #286 | Tragic 42.9% |
| Guatemalans | 0.0 /100 | #287 | Tragic 42.9% |
| Natives/Alaskans | 0.0 /100 | #288 | Tragic 42.8% |
| Paiute | 0.0 /100 | #289 | Tragic 42.7% |
| Immigrants | Ghana | 0.0 /100 | #290 | Tragic 42.7% |
| Immigrants | Guatemala | 0.0 /100 | #291 | Tragic 42.6% |
| Sub-Saharan Africans | 0.0 /100 | #292 | Tragic 42.6% |
| Yuman | 0.0 /100 | #293 | Tragic 42.6% |
| Hondurans | 0.0 /100 | #294 | Tragic 42.5% |
| Immigrants | Western Africa | 0.0 /100 | #295 | Tragic 42.4% |
| Menominee | 0.0 /100 | #296 | Tragic 42.3% |
| Cheyenne | 0.0 /100 | #297 | Tragic 42.2% |
| Immigrants | Honduras | 0.0 /100 | #298 | Tragic 42.2% |
| Liberians | 0.0 /100 | #299 | Tragic 42.2% |
Demographics Similar to Syrians by Currently Married
In terms of currently married, the demographic groups most similar to Syrians are Immigrants from Croatia (47.5%, a difference of 0.030%), Osage (47.5%, a difference of 0.090%), Immigrants from Philippines (47.6%, a difference of 0.12%), Australian (47.6%, a difference of 0.12%), and Puget Sound Salish (47.6%, a difference of 0.13%).
| Demographics | Rating | Rank | Currently Married |
| Immigrants | Denmark | 90.9 /100 | #113 | Exceptional 47.6% |
| South Africans | 90.5 /100 | #114 | Exceptional 47.6% |
| Immigrants | Indonesia | 90.5 /100 | #115 | Exceptional 47.6% |
| Palestinians | 90.4 /100 | #116 | Exceptional 47.6% |
| Puget Sound Salish | 90.3 /100 | #117 | Exceptional 47.6% |
| Immigrants | Philippines | 90.2 /100 | #118 | Exceptional 47.6% |
| Australians | 90.2 /100 | #119 | Exceptional 47.6% |
| Syrians | 88.9 /100 | #120 | Excellent 47.5% |
| Immigrants | Croatia | 88.6 /100 | #121 | Excellent 47.5% |
| Osage | 87.9 /100 | #122 | Excellent 47.5% |
| Immigrants | Kazakhstan | 87.2 /100 | #123 | Excellent 47.4% |
| Laotians | 86.6 /100 | #124 | Excellent 47.4% |
| Okinawans | 85.3 /100 | #125 | Excellent 47.4% |
| Immigrants | Jordan | 84.9 /100 | #126 | Excellent 47.4% |
| New Zealanders | 84.9 /100 | #127 | Excellent 47.4% |