Spanish American vs Japanese Average Family Size
COMPARE
Spanish American
Japanese
Average Family Size
Average Family Size Comparison
Spanish Americans
Japanese
3.24
AVERAGE FAMILY SIZE
72.5/ 100
METRIC RATING
152nd/ 347
METRIC RANK
3.35
AVERAGE FAMILY SIZE
100.0/ 100
METRIC RATING
59th/ 347
METRIC RANK
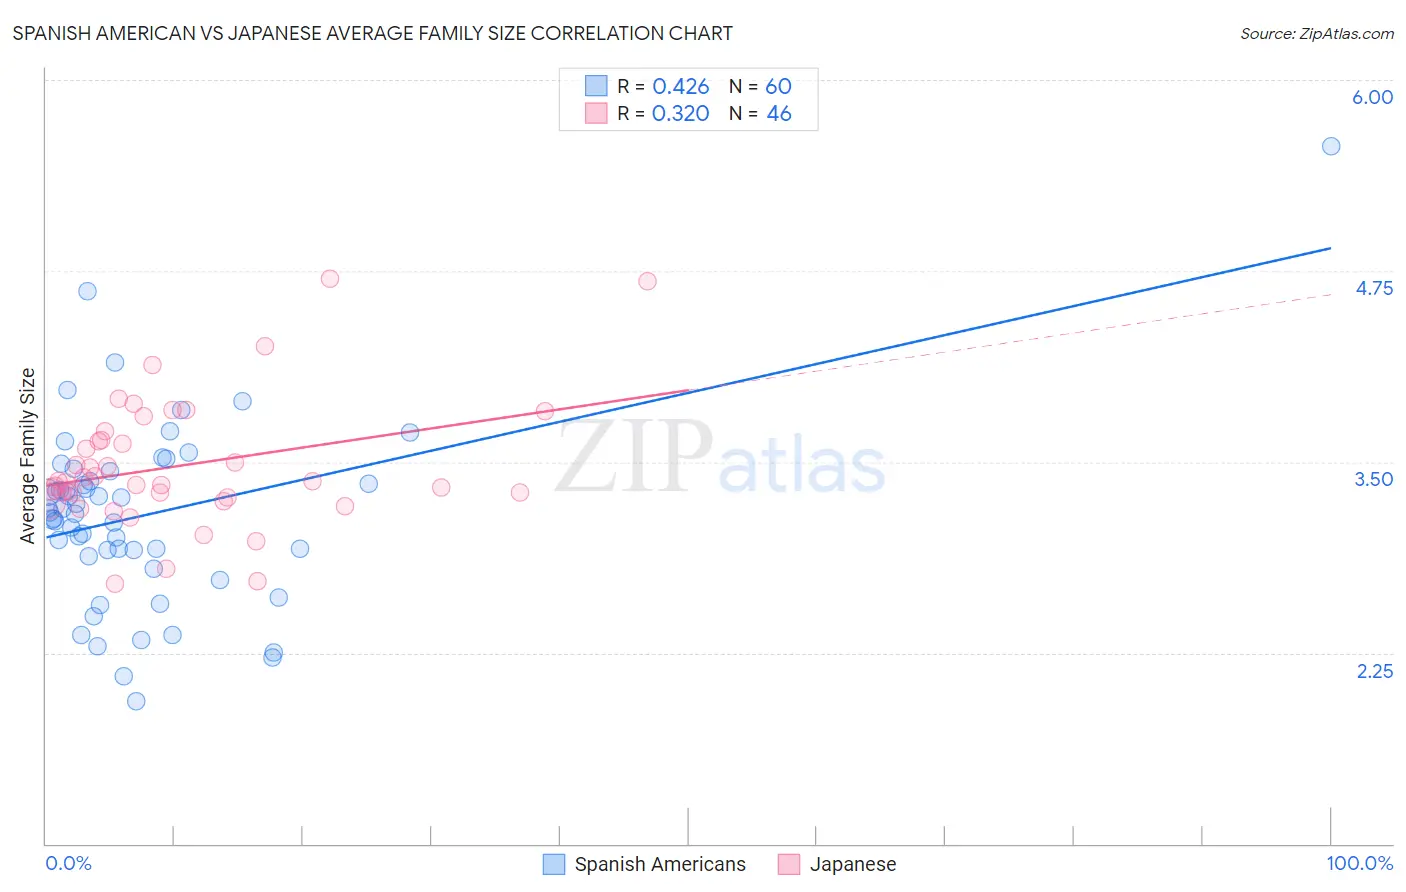
Spanish American vs Japanese Average Family Size Correlation Chart
The statistical analysis conducted on geographies consisting of 103,168,621 people shows a moderate positive correlation between the proportion of Spanish Americans and average family size in the United States with a correlation coefficient (R) of 0.426 and weighted average of 3.24. Similarly, the statistical analysis conducted on geographies consisting of 249,073,483 people shows a mild positive correlation between the proportion of Japanese and average family size in the United States with a correlation coefficient (R) of 0.320 and weighted average of 3.35, a difference of 3.3%.
Average Family Size Correlation Summary
| Measurement | Spanish American | Japanese |
| Minimum | 1.93 | 2.70 |
| Maximum | 5.56 | 4.70 |
| Range | 3.63 | 2.00 |
| Mean | 3.15 | 3.47 |
| Median | 3.17 | 3.37 |
| Interquartile 25% (IQ1) | 2.90 | 3.27 |
| Interquartile 75% (IQ3) | 3.41 | 3.65 |
| Interquartile Range (IQR) | 0.51 | 0.38 |
| Standard Deviation (Sample) | 0.61 | 0.42 |
| Standard Deviation (Population) | 0.60 | 0.41 |
Similar Demographics by Average Family Size
Demographics Similar to Spanish Americans by Average Family Size
In terms of average family size, the demographic groups most similar to Spanish Americans are Jordanian (3.24, a difference of 0.020%), Immigrants from Eritrea (3.24, a difference of 0.020%), Assyrian/Chaldean/Syriac (3.24, a difference of 0.030%), Indian (Asian) (3.24, a difference of 0.030%), and Blackfeet (3.24, a difference of 0.060%).
| Demographics | Rating | Rank | Average Family Size |
| Armenians | 78.2 /100 | #145 | Good 3.25 |
| Immigrants | Africa | 77.9 /100 | #146 | Good 3.25 |
| Immigrants | Jordan | 75.7 /100 | #147 | Good 3.24 |
| Blackfeet | 75.0 /100 | #148 | Good 3.24 |
| Assyrians/Chaldeans/Syriacs | 73.8 /100 | #149 | Good 3.24 |
| Indians (Asian) | 73.6 /100 | #150 | Good 3.24 |
| Jordanians | 73.5 /100 | #151 | Good 3.24 |
| Spanish Americans | 72.5 /100 | #152 | Good 3.24 |
| Immigrants | Eritrea | 71.4 /100 | #153 | Good 3.24 |
| Immigrants | Egypt | 70.0 /100 | #154 | Good 3.24 |
| Seminole | 68.2 /100 | #155 | Good 3.24 |
| Immigrants | Taiwan | 68.1 /100 | #156 | Good 3.24 |
| Immigrants | Uzbekistan | 67.0 /100 | #157 | Good 3.24 |
| Iraqis | 64.3 /100 | #158 | Good 3.24 |
| Ethiopians | 63.9 /100 | #159 | Good 3.24 |
Demographics Similar to Japanese by Average Family Size
In terms of average family size, the demographic groups most similar to Japanese are Immigrants from Armenia (3.35, a difference of 0.020%), Central American Indian (3.35, a difference of 0.050%), Honduran (3.35, a difference of 0.090%), Sri Lankan (3.35, a difference of 0.10%), and Immigrants from Dominican Republic (3.35, a difference of 0.15%).
| Demographics | Rating | Rank | Average Family Size |
| Fijians | 100.0 /100 | #52 | Exceptional 3.36 |
| Koreans | 100.0 /100 | #53 | Exceptional 3.36 |
| Immigrants | South Eastern Asia | 100.0 /100 | #54 | Exceptional 3.36 |
| Immigrants | Honduras | 100.0 /100 | #55 | Exceptional 3.36 |
| Immigrants | Dominican Republic | 100.0 /100 | #56 | Exceptional 3.35 |
| Sri Lankans | 100.0 /100 | #57 | Exceptional 3.35 |
| Hondurans | 100.0 /100 | #58 | Exceptional 3.35 |
| Japanese | 100.0 /100 | #59 | Exceptional 3.35 |
| Immigrants | Armenia | 100.0 /100 | #60 | Exceptional 3.35 |
| Central American Indians | 100.0 /100 | #61 | Exceptional 3.35 |
| Immigrants | Grenada | 100.0 /100 | #62 | Exceptional 3.34 |
| Chinese | 100.0 /100 | #63 | Exceptional 3.34 |
| Dominicans | 99.9 /100 | #64 | Exceptional 3.34 |
| Immigrants | Laos | 99.9 /100 | #65 | Exceptional 3.34 |
| Immigrants | St. Vincent and the Grenadines | 99.9 /100 | #66 | Exceptional 3.34 |