Spanish American Indian vs Immigrants from Australia Single Father Households
COMPARE
Spanish American Indian
Immigrants from Australia
Single Father Households
Single Father Households Comparison
Spanish American Indians
Immigrants from Australia
2.9%
SINGLE FATHER HOUSEHOLDS
0.0/ 100
METRIC RATING
311th/ 347
METRIC RANK
2.0%
SINGLE FATHER HOUSEHOLDS
100.0/ 100
METRIC RATING
34th/ 347
METRIC RANK
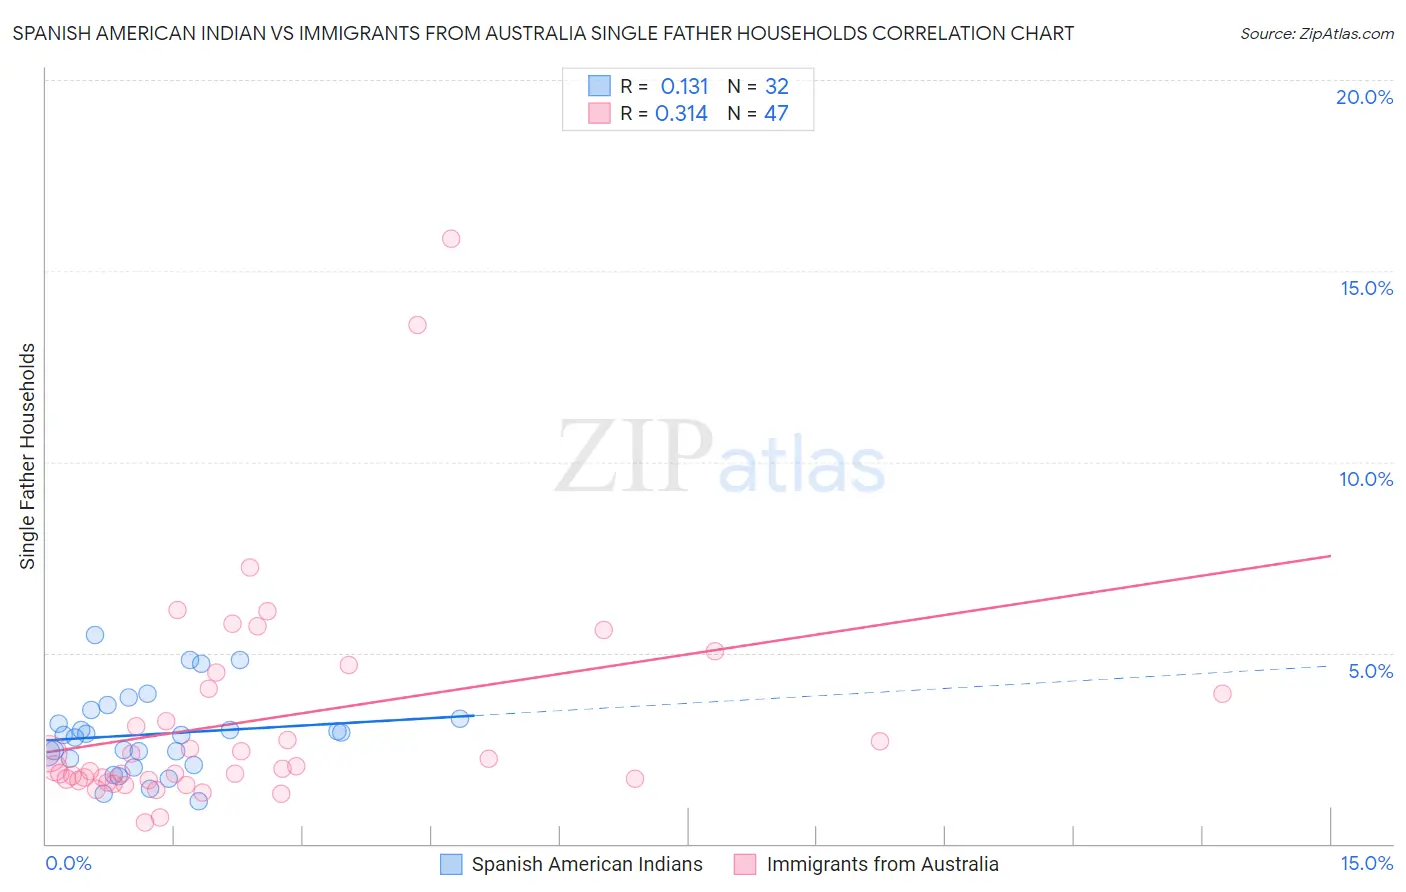
Spanish American Indian vs Immigrants from Australia Single Father Households Correlation Chart
The statistical analysis conducted on geographies consisting of 73,114,798 people shows a poor positive correlation between the proportion of Spanish American Indians and percentage of single father households in the United States with a correlation coefficient (R) of 0.131 and weighted average of 2.9%. Similarly, the statistical analysis conducted on geographies consisting of 225,821,838 people shows a mild positive correlation between the proportion of Immigrants from Australia and percentage of single father households in the United States with a correlation coefficient (R) of 0.314 and weighted average of 2.0%, a difference of 45.4%.
Single Father Households Correlation Summary
| Measurement | Spanish American Indian | Immigrants from Australia |
| Minimum | 1.1% | 0.57% |
| Maximum | 5.5% | 15.8% |
| Range | 4.4% | 15.3% |
| Mean | 2.9% | 3.2% |
| Median | 2.8% | 2.0% |
| Interquartile 25% (IQ1) | 2.1% | 1.7% |
| Interquartile 75% (IQ3) | 3.4% | 4.1% |
| Interquartile Range (IQR) | 1.3% | 2.4% |
| Standard Deviation (Sample) | 1.1% | 2.9% |
| Standard Deviation (Population) | 1.0% | 2.9% |
Similar Demographics by Single Father Households
Demographics Similar to Spanish American Indians by Single Father Households
In terms of single father households, the demographic groups most similar to Spanish American Indians are Immigrants from Laos (2.9%, a difference of 0.48%), Tsimshian (2.9%, a difference of 0.57%), Central American (2.9%, a difference of 0.69%), Arapaho (2.9%, a difference of 0.99%), and Salvadoran (2.9%, a difference of 1.2%).
| Demographics | Rating | Rank | Single Father Households |
| Mexican American Indians | 0.0 /100 | #304 | Tragic 2.8% |
| Hispanics or Latinos | 0.0 /100 | #305 | Tragic 2.8% |
| Immigrants | Azores | 0.0 /100 | #306 | Tragic 2.8% |
| Hopi | 0.0 /100 | #307 | Tragic 2.8% |
| Apache | 0.0 /100 | #308 | Tragic 2.8% |
| Central Americans | 0.0 /100 | #309 | Tragic 2.9% |
| Immigrants | Laos | 0.0 /100 | #310 | Tragic 2.9% |
| Spanish American Indians | 0.0 /100 | #311 | Tragic 2.9% |
| Tsimshian | 0.0 /100 | #312 | Tragic 2.9% |
| Arapaho | 0.0 /100 | #313 | Tragic 2.9% |
| Salvadorans | 0.0 /100 | #314 | Tragic 2.9% |
| Cheyenne | 0.0 /100 | #315 | Tragic 2.9% |
| Houma | 0.0 /100 | #316 | Tragic 2.9% |
| Immigrants | El Salvador | 0.0 /100 | #317 | Tragic 2.9% |
| Cape Verdeans | 0.0 /100 | #318 | Tragic 2.9% |
Demographics Similar to Immigrants from Australia by Single Father Households
In terms of single father households, the demographic groups most similar to Immigrants from Australia are Turkish (2.0%, a difference of 0.020%), Chinese (2.0%, a difference of 0.23%), Israeli (2.0%, a difference of 0.28%), Cambodian (2.0%, a difference of 0.31%), and Albanian (2.0%, a difference of 0.32%).
| Demographics | Rating | Rank | Single Father Households |
| Immigrants | South Central Asia | 100.0 /100 | #27 | Exceptional 2.0% |
| Immigrants | Japan | 100.0 /100 | #28 | Exceptional 2.0% |
| Bulgarians | 100.0 /100 | #29 | Exceptional 2.0% |
| Cambodians | 100.0 /100 | #30 | Exceptional 2.0% |
| Israelis | 100.0 /100 | #31 | Exceptional 2.0% |
| Chinese | 100.0 /100 | #32 | Exceptional 2.0% |
| Turks | 100.0 /100 | #33 | Exceptional 2.0% |
| Immigrants | Australia | 100.0 /100 | #34 | Exceptional 2.0% |
| Albanians | 100.0 /100 | #35 | Exceptional 2.0% |
| Immigrants | Belgium | 100.0 /100 | #36 | Exceptional 2.0% |
| Immigrants | St. Vincent and the Grenadines | 100.0 /100 | #37 | Exceptional 2.0% |
| Immigrants | Eastern Europe | 100.0 /100 | #38 | Exceptional 2.0% |
| Immigrants | Sri Lanka | 100.0 /100 | #39 | Exceptional 2.0% |
| Immigrants | Bulgaria | 100.0 /100 | #40 | Exceptional 2.0% |
| Immigrants | Turkey | 100.0 /100 | #41 | Exceptional 2.0% |