Slovak vs Cypriot Single Father Households

COMPARE

Slovak
Race
Ancestry
AfghanAfricanAlaska NativeAlaskan AthabascanAlbanianAleutAlsatianAmericanApacheArabArapahoArgentineanArmenianAssyrian/Chaldean/SyriacAustralianAustrianBahamianBangladeshiBarbadianBasqueBelgianBelizeanBermudanBhutaneseBlackfeetBolivianBrazilianBritishBritish West IndianBulgarianBurmeseCajunCambodianCanadianCape VerdeanCarpatho RusynCelticCentral AmericanCentral American IndianCherokeeCheyenneChickasawChileanChineseChippewaChoctawColombianColvilleComancheCosta RicanCreeCreekCroatianCrowCubanCzechCzechoslovakianDanishDelawareDominicanDutchDutch West IndianEastern EuropeanEcuadorianEgyptianEnglishEstonianEthiopianEuropeanFijianFilipinoFinnishFrenchFrench American IndianFrench CanadianGermanGerman RussianGhanaianGreekGuamanian/ChamorroGuatemalanGuyaneseHaitianHmongHonduranHopiHoumaHungarianIcelanderIndian (Asian)IndonesianInupiatIranianIraqiIrishIroquoisIsraeliItalianJamaicanJapaneseJordanianKenyanKiowaKoreanLaotianLatvianLebaneseLiberianLithuanianLumbeeLuxembourgerMacedonianMalaysianMalteseMarshalleseMenomineeMexicanMexican American IndianMongolianMoroccanNative HawaiianNavajoNepaleseNew ZealanderNicaraguanNigerianNorthern EuropeanNorwegianOkinawanOsageOttawaPaiutePakistaniPalestinianPanamanianParaguayanPennsylvania GermanPeruvianPimaPolishPortuguesePotawatomiPuebloPuerto RicanPuget Sound SalishRomanianRussianSalvadoranSamoanScandinavianScotch-IrishScottishSeminoleSenegaleseSerbianShoshoneSierra LeoneanSiouxSlavicSlovakSloveneSomaliSouth AfricanSouth AmericanSouth American IndianSoviet UnionSpaniardSpanishSpanish AmericanSpanish American IndianSri LankanSubsaharan AfricanSudaneseSwedishSwissSyrianTaiwaneseThaiTlingit-HaidaTohono O'OdhamTonganTrinidadian and TobagonianTsimshianTurkishU.S. Virgin IslanderUgandanUkrainianUruguayanUteVenezuelanVietnameseWelshWest IndianYakamaYaquiYugoslavianYumanYup'ikZimbabwean
Immigration
NonimmigrantsImmigrantsAfghanistanAfricaAlbaniaArgentinaArmeniaAsiaAustraliaAustriaBahamasBangladeshBarbadosBelarusBelgiumBelizeBoliviaBosnia and HerzegovinaBrazilBulgariaBurma/MyanmarCabo VerdeCambodiaCameroonCanadaCaribbeanCentral AmericaChileChinaColombiaCongoCosta RicaCroatiaCubaCzechoslovakiaDenmarkDominicaDominican RepublicEastern AfricaEastern AsiaEastern EuropeEcuadorEgyptEl SalvadorEnglandEritreaEthiopiaEuropeFijiFranceGermanyGhanaGreeceGrenadaGuatemalaGuyanaHaitiHondurasHong KongHungaryIndiaIndonesiaIranIraqIrelandIsraelItalyJamaicaJapanJordanKazakhstanKenyaKoreaKuwaitLaosLatin AmericaLatviaLebanonLiberiaLithuaniaMalaysiaMexicoMicronesiaMiddle AfricaMoldovaMoroccoNepalNetherlandsNicaraguaNigeriaNorth AmericaNorth MacedoniaNorthern AfricaNorthern EuropeNorwayOceaniaPakistanPanamaPeruPhilippinesPolandPortugalRomaniaRussiaSaudi ArabiaScotlandSenegalSerbiaSierra LeoneSingaporeSomaliaSouth AfricaSouth AmericaSouth Central AsiaSouth Eastern AsiaSouthern EuropeSpainSri LankaSt. Vincent and the GrenadinesSudanSwedenSwitzerlandSyriaTaiwanThailandTrinidad and TobagoTurkeyUgandaUkraineUruguayUzbekistanVenezuelaVietnamWest IndiesWestern AfricaWestern AsiaWestern EuropeYemenZaireZimbabweAzores
Cypriot
Race
Ancestry
AfghanAfricanAlaska NativeAlaskan AthabascanAlbanianAleutAlsatianAmericanApacheArabArapahoArgentineanArmenianAssyrian/Chaldean/SyriacAustralianAustrianBahamianBangladeshiBarbadianBasqueBelgianBelizeanBermudanBhutaneseBlackfeetBolivianBrazilianBritishBritish West IndianBulgarianBurmeseCajunCambodianCanadianCape VerdeanCarpatho RusynCelticCentral AmericanCentral American IndianCherokeeCheyenneChickasawChileanChineseChippewaChoctawColombianColvilleComancheCosta RicanCreeCreekCroatianCrowCubanCypriotCzechCzechoslovakianDanishDelawareDominicanDutchDutch West IndianEastern EuropeanEcuadorianEgyptianEnglishEstonianEthiopianEuropeanFijianFilipinoFinnishFrenchFrench American IndianFrench CanadianGermanGerman RussianGhanaianGreekGuamanian/ChamorroGuatemalanGuyaneseHaitianHmongHonduranHopiHoumaHungarianIcelanderIndian (Asian)IndonesianInupiatIranianIraqiIrishIroquoisIsraeliItalianJamaicanJapaneseJordanianKenyanKiowaKoreanLaotianLatvianLebaneseLiberianLithuanianLumbeeLuxembourgerMacedonianMalaysianMalteseMarshalleseMenomineeMexicanMexican American IndianMongolianMoroccanNative HawaiianNavajoNepaleseNew ZealanderNicaraguanNigerianNorthern EuropeanNorwegianOkinawanOsageOttawaPaiutePakistaniPalestinianPanamanianParaguayanPennsylvania GermanPeruvianPimaPolishPortuguesePotawatomiPuebloPuerto RicanPuget Sound SalishRomanianRussianSalvadoranSamoanScandinavianScotch-IrishScottishSeminoleSenegaleseSerbianShoshoneSierra LeoneanSiouxSlavicSloveneSomaliSouth AfricanSouth AmericanSouth American IndianSoviet UnionSpaniardSpanishSpanish AmericanSpanish American IndianSri LankanSubsaharan AfricanSudaneseSwedishSwissSyrianTaiwaneseThaiTlingit-HaidaTohono O'OdhamTonganTrinidadian and TobagonianTsimshianTurkishU.S. Virgin IslanderUgandanUkrainianUruguayanUteVenezuelanVietnameseWelshWest IndianYakamaYaquiYugoslavianYumanYup'ikZimbabwean
Immigration
NonimmigrantsImmigrantsAfghanistanAfricaAlbaniaArgentinaArmeniaAsiaAustraliaAustriaBahamasBangladeshBarbadosBelarusBelgiumBelizeBoliviaBosnia and HerzegovinaBrazilBulgariaBurma/MyanmarCabo VerdeCambodiaCameroonCanadaCaribbeanCentral AmericaChileChinaColombiaCongoCosta RicaCroatiaCubaCzechoslovakiaDenmarkDominicaDominican RepublicEastern AfricaEastern AsiaEastern EuropeEcuadorEgyptEl SalvadorEnglandEritreaEthiopiaEuropeFijiFranceGermanyGhanaGreeceGrenadaGuatemalaGuyanaHaitiHondurasHong KongHungaryIndiaIndonesiaIranIraqIrelandIsraelItalyJamaicaJapanJordanKazakhstanKenyaKoreaKuwaitLaosLatin AmericaLatviaLebanonLiberiaLithuaniaMalaysiaMexicoMicronesiaMiddle AfricaMoldovaMoroccoNepalNetherlandsNicaraguaNigeriaNorth AmericaNorth MacedoniaNorthern AfricaNorthern EuropeNorwayOceaniaPakistanPanamaPeruPhilippinesPolandPortugalRomaniaRussiaSaudi ArabiaScotlandSenegalSerbiaSierra LeoneSingaporeSomaliaSouth AfricaSouth AmericaSouth Central AsiaSouth Eastern AsiaSouthern EuropeSpainSri LankaSt. Vincent and the GrenadinesSudanSwedenSwitzerlandSyriaTaiwanThailandTrinidad and TobagoTurkeyUgandaUkraineUruguayUzbekistanVenezuelaVietnamWest IndiesWestern AfricaWestern AsiaWestern EuropeYemenZaireZimbabweAzores
Single Father Households
Income
Poverty
Unemployment
Labor Participation
Family Structure
Vehicle Availability
Education Level
Disability

Single Father Households Comparison

Slovaks

Cypriots

Exceptional
Exceptional
2.2%
SINGLE FATHER HOUSEHOLDS
90.7/ 100
METRIC RATING
144th/ 347
METRIC RANK
1.8%
SINGLE FATHER HOUSEHOLDS
100.0/ 100
METRIC RATING
7th/ 347
METRIC RANK

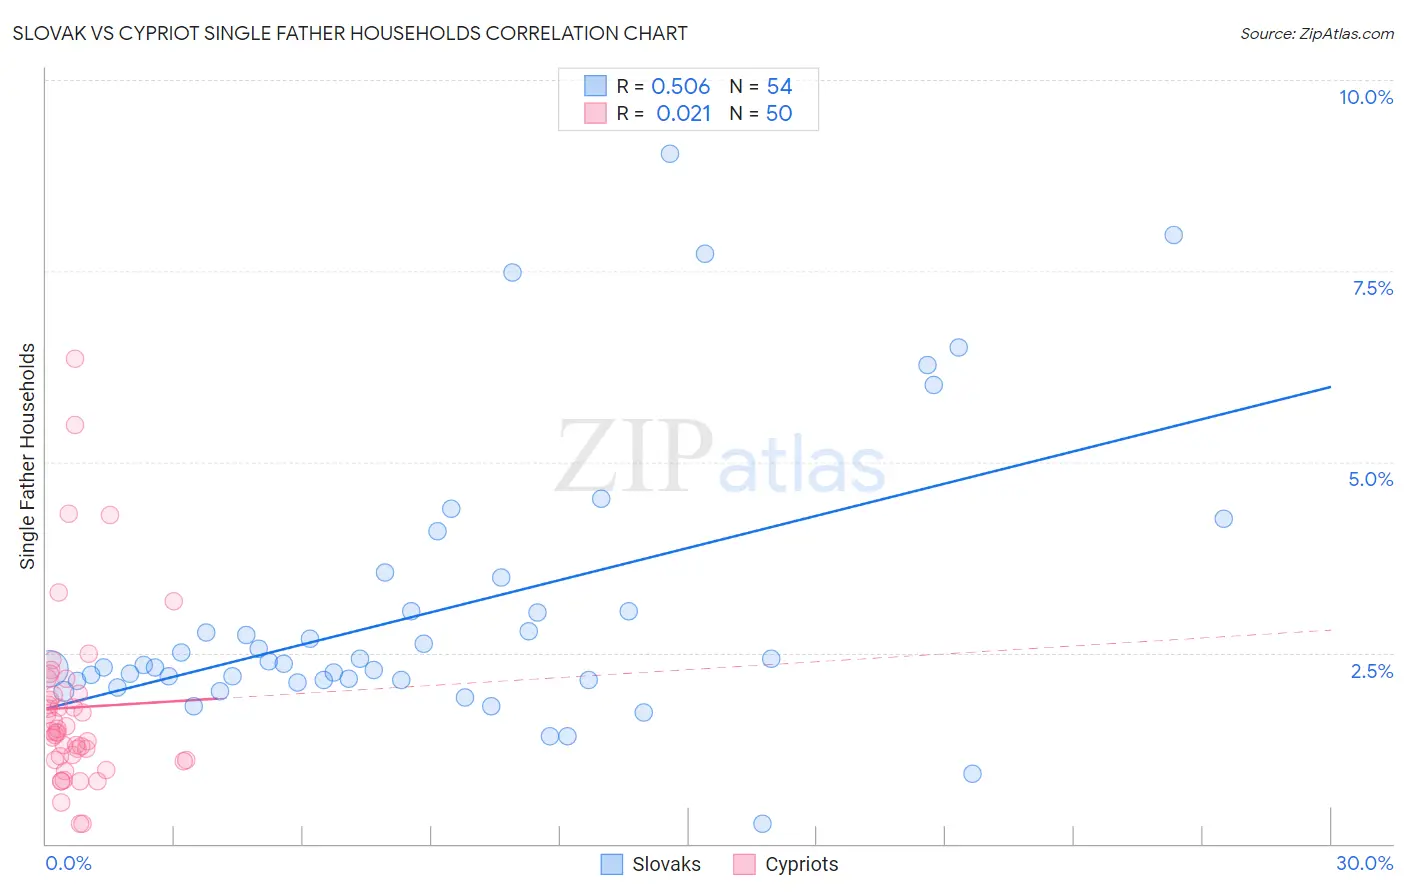
Slovak vs Cypriot Single Father Households Correlation Chart

The statistical analysis conducted on geographies consisting of 393,166,504 people shows a substantial positive correlation between the proportion of Slovaks and percentage of single father households in the United States with a correlation coefficient (R) of 0.506 and weighted average of 2.2%. Similarly, the statistical analysis conducted on geographies consisting of 61,632,600 people shows no correlation between the proportion of Cypriots and percentage of single father households in the United States with a correlation coefficient (R) of 0.021 and weighted average of 1.8%, a difference of 21.6%.
Slovak vs Cypriot Single Father Households

Single Father Households Correlation Summary

MeasurementSlovakCypriot
Minimum0.26%0.26%
Maximum9.0%6.4%
Range8.8%6.1%
Mean3.1%1.8%
Median2.3%1.5%
Interquartile 25% (IQ1)2.1%1.1%
Interquartile 75% (IQ3)3.0%2.0%
Interquartile Range (IQR)0.91%0.87%
Standard Deviation (Sample)1.8%1.2%
Standard Deviation (Population)1.8%1.2%

Similar Demographics by Single Father Households

Demographics Similar to Slovaks by Single Father Households

In terms of single father households, the demographic groups most similar to Slovaks are Immigrants from Zimbabwe (2.2%, a difference of 0.11%), Northern European (2.2%, a difference of 0.19%), Immigrants from Nepal (2.2%, a difference of 0.34%), Slavic (2.2%, a difference of 0.37%), and Luxembourger (2.2%, a difference of 0.40%).
DemographicsRating | RankSingle Father Households
Austrians
94.2
/100
|
#137
Exceptional
2.2%
West Indians
94.1
/100
|
#138
Exceptional
2.2%
Brazilians
92.8
/100
|
#139
Exceptional
2.2%
British
92.8
/100
|
#140
Exceptional
2.2%
Laotians
92.5
/100
|
#141
Exceptional
2.2%
Luxembourgers
92.3
/100
|
#142
Exceptional
2.2%
Immigrants | Nepal
92.1
/100
|
#143
Exceptional
2.2%
Slovaks
90.7
/100
|
#144
Exceptional
2.2%
Immigrants | Zimbabwe
90.2
/100
|
#145
Exceptional
2.2%
Northern Europeans
89.8
/100
|
#146
Excellent
2.2%
Slavs
88.9
/100
|
#147
Excellent
2.2%
South American Indians
88.5
/100
|
#148
Excellent
2.3%
Senegalese
88.4
/100
|
#149
Excellent
2.3%
Venezuelans
86.2
/100
|
#150
Excellent
2.3%
Immigrants | Syria
84.8
/100
|
#151
Excellent
2.3%

Demographics Similar to Cypriots by Single Father Households

In terms of single father households, the demographic groups most similar to Cypriots are Immigrants from Ireland (1.8%, a difference of 0.11%), Immigrants from Taiwan (1.8%, a difference of 0.16%), Immigrants from China (1.8%, a difference of 0.25%), Immigrants from Hong Kong (1.8%, a difference of 0.52%), and Okinawan (1.9%, a difference of 0.61%).
DemographicsRating | RankSingle Father Households
Soviet Union
100.0
/100
|
#1
Exceptional
1.8%
Immigrants | Israel
100.0
/100
|
#2
Exceptional
1.8%
Filipinos
100.0
/100
|
#3
Exceptional
1.8%
Immigrants | Uzbekistan
100.0
/100
|
#4
Exceptional
1.8%
Immigrants | Hong Kong
100.0
/100
|
#5
Exceptional
1.8%
Immigrants | Taiwan
100.0
/100
|
#6
Exceptional
1.8%
Cypriots
100.0
/100
|
#7
Exceptional
1.8%
Immigrants | Ireland
100.0
/100
|
#8
Exceptional
1.8%
Immigrants | China
100.0
/100
|
#9
Exceptional
1.8%
Okinawans
100.0
/100
|
#10
Exceptional
1.9%
Immigrants | Belarus
100.0
/100
|
#11
Exceptional
1.9%
Immigrants | Greece
100.0
/100
|
#12
Exceptional
1.9%
Immigrants | Singapore
100.0
/100
|
#13
Exceptional
1.9%
Immigrants | Lithuania
100.0
/100
|
#14
Exceptional
1.9%
Immigrants | Eastern Asia
100.0
/100
|
#15
Exceptional
1.9%