Slavic vs Immigrants from Romania Divorced or Separated

COMPARE

Slavic
Race
Ancestry
AfghanAfricanAlaska NativeAlaskan AthabascanAlbanianAleutAlsatianAmericanApacheArabArapahoArgentineanArmenianAssyrian/Chaldean/SyriacAustralianAustrianBahamianBangladeshiBarbadianBasqueBelgianBelizeanBermudanBhutaneseBlackfeetBolivianBrazilianBritishBritish West IndianBulgarianBurmeseCajunCambodianCanadianCape VerdeanCarpatho RusynCelticCentral AmericanCentral American IndianCherokeeCheyenneChickasawChileanChineseChippewaChoctawColombianColvilleComancheCosta RicanCreeCreekCroatianCrowCubanCypriotCzechCzechoslovakianDanishDelawareDominicanDutchDutch West IndianEastern EuropeanEcuadorianEgyptianEnglishEstonianEthiopianEuropeanFijianFilipinoFinnishFrenchFrench American IndianFrench CanadianGermanGerman RussianGhanaianGreekGuamanian/ChamorroGuatemalanGuyaneseHaitianHmongHonduranHopiHoumaHungarianIcelanderIndian (Asian)IndonesianInupiatIranianIraqiIrishIroquoisIsraeliItalianJamaicanJapaneseJordanianKenyanKiowaKoreanLaotianLatvianLebaneseLiberianLithuanianLumbeeLuxembourgerMacedonianMalaysianMalteseMarshalleseMenomineeMexicanMexican American IndianMongolianMoroccanNative HawaiianNavajoNepaleseNew ZealanderNicaraguanNigerianNorthern EuropeanNorwegianOkinawanOsageOttawaPaiutePakistaniPalestinianPanamanianParaguayanPennsylvania GermanPeruvianPimaPolishPortuguesePotawatomiPuebloPuerto RicanPuget Sound SalishRomanianRussianSalvadoranSamoanScandinavianScotch-IrishScottishSeminoleSenegaleseSerbianShoshoneSierra LeoneanSiouxSlavicSlovakSloveneSomaliSouth AfricanSouth AmericanSouth American IndianSoviet UnionSpaniardSpanishSpanish AmericanSpanish American IndianSri LankanSubsaharan AfricanSudaneseSwedishSwissSyrianTaiwaneseThaiTlingit-HaidaTohono O'OdhamTonganTrinidadian and TobagonianTsimshianTurkishU.S. Virgin IslanderUgandanUkrainianUruguayanUteVenezuelanVietnameseWelshWest IndianYakamaYaquiYugoslavianYumanYup'ikZimbabwean
Immigration
NonimmigrantsImmigrantsAfghanistanAfricaAlbaniaArgentinaArmeniaAsiaAustraliaAustriaBahamasBangladeshBarbadosBelarusBelgiumBelizeBoliviaBosnia and HerzegovinaBrazilBulgariaBurma/MyanmarCabo VerdeCambodiaCameroonCanadaCaribbeanCentral AmericaChileChinaColombiaCongoCosta RicaCroatiaCubaCzechoslovakiaDenmarkDominicaDominican RepublicEastern AfricaEastern AsiaEastern EuropeEcuadorEgyptEl SalvadorEnglandEritreaEthiopiaEuropeFijiFranceGermanyGhanaGreeceGrenadaGuatemalaGuyanaHaitiHondurasHong KongHungaryIndiaIndonesiaIranIraqIrelandIsraelItalyJamaicaJapanJordanKazakhstanKenyaKoreaKuwaitLaosLatin AmericaLatviaLebanonLiberiaLithuaniaMalaysiaMexicoMicronesiaMiddle AfricaMoldovaMoroccoNepalNetherlandsNicaraguaNigeriaNorth AmericaNorth MacedoniaNorthern AfricaNorthern EuropeNorwayOceaniaPakistanPanamaPeruPhilippinesPolandPortugalRussiaSaudi ArabiaScotlandSenegalSerbiaSierra LeoneSingaporeSomaliaSouth AfricaSouth AmericaSouth Central AsiaSouth Eastern AsiaSouthern EuropeSpainSri LankaSt. Vincent and the GrenadinesSudanSwedenSwitzerlandSyriaTaiwanThailandTrinidad and TobagoTurkeyUgandaUkraineUruguayUzbekistanVenezuelaVietnamWest IndiesWestern AfricaWestern AsiaWestern EuropeYemenZaireZimbabweAzores
Immigrants from Romania
Race
Ancestry
AfghanAfricanAlaska NativeAlaskan AthabascanAlbanianAleutAlsatianAmericanApacheArabArapahoArgentineanArmenianAssyrian/Chaldean/SyriacAustralianAustrianBahamianBangladeshiBarbadianBasqueBelgianBelizeanBermudanBhutaneseBlackfeetBolivianBrazilianBritishBritish West IndianBulgarianBurmeseCajunCambodianCanadianCape VerdeanCarpatho RusynCelticCentral AmericanCentral American IndianCherokeeCheyenneChickasawChileanChineseChippewaChoctawColombianColvilleComancheCosta RicanCreeCreekCroatianCrowCubanCypriotCzechCzechoslovakianDanishDelawareDominicanDutchDutch West IndianEastern EuropeanEcuadorianEgyptianEnglishEstonianEthiopianEuropeanFijianFilipinoFinnishFrenchFrench American IndianFrench CanadianGermanGerman RussianGhanaianGreekGuamanian/ChamorroGuatemalanGuyaneseHaitianHmongHonduranHopiHoumaHungarianIcelanderIndian (Asian)IndonesianInupiatIranianIraqiIrishIroquoisIsraeliItalianJamaicanJapaneseJordanianKenyanKiowaKoreanLaotianLatvianLebaneseLiberianLithuanianLumbeeLuxembourgerMacedonianMalaysianMalteseMarshalleseMenomineeMexicanMexican American IndianMongolianMoroccanNative HawaiianNavajoNepaleseNew ZealanderNicaraguanNigerianNorthern EuropeanNorwegianOkinawanOsageOttawaPaiutePakistaniPalestinianPanamanianParaguayanPennsylvania GermanPeruvianPimaPolishPortuguesePotawatomiPuebloPuerto RicanPuget Sound SalishRomanianRussianSalvadoranSamoanScandinavianScotch-IrishScottishSeminoleSenegaleseSerbianShoshoneSierra LeoneanSiouxSlovakSloveneSomaliSouth AfricanSouth AmericanSouth American IndianSoviet UnionSpaniardSpanishSpanish AmericanSpanish American IndianSri LankanSubsaharan AfricanSudaneseSwedishSwissSyrianTaiwaneseThaiTlingit-HaidaTohono O'OdhamTonganTrinidadian and TobagonianTsimshianTurkishU.S. Virgin IslanderUgandanUkrainianUruguayanUteVenezuelanVietnameseWelshWest IndianYakamaYaquiYugoslavianYumanYup'ikZimbabwean
Immigration
NonimmigrantsImmigrantsAfghanistanAfricaAlbaniaArgentinaArmeniaAsiaAustraliaAustriaBahamasBangladeshBarbadosBelarusBelgiumBelizeBoliviaBosnia and HerzegovinaBrazilBulgariaBurma/MyanmarCabo VerdeCambodiaCameroonCanadaCaribbeanCentral AmericaChileChinaColombiaCongoCosta RicaCroatiaCubaCzechoslovakiaDenmarkDominicaDominican RepublicEastern AfricaEastern AsiaEastern EuropeEcuadorEgyptEl SalvadorEnglandEritreaEthiopiaEuropeFijiFranceGermanyGhanaGreeceGrenadaGuatemalaGuyanaHaitiHondurasHong KongHungaryIndiaIndonesiaIranIraqIrelandIsraelItalyJamaicaJapanJordanKazakhstanKenyaKoreaKuwaitLaosLatin AmericaLatviaLebanonLiberiaLithuaniaMalaysiaMexicoMicronesiaMiddle AfricaMoldovaMoroccoNepalNetherlandsNicaraguaNigeriaNorth AmericaNorth MacedoniaNorthern AfricaNorthern EuropeNorwayOceaniaPakistanPanamaPeruPhilippinesPolandPortugalRomaniaRussiaSaudi ArabiaScotlandSenegalSerbiaSierra LeoneSingaporeSomaliaSouth AfricaSouth AmericaSouth Central AsiaSouth Eastern AsiaSouthern EuropeSpainSri LankaSt. Vincent and the GrenadinesSudanSwedenSwitzerlandSyriaTaiwanThailandTrinidad and TobagoTurkeyUgandaUkraineUruguayUzbekistanVenezuelaVietnamWest IndiesWestern AfricaWestern AsiaWestern EuropeYemenZaireZimbabweAzores
Divorced or Separated
Income
Poverty
Unemployment
Labor Participation
Family Structure
Vehicle Availability
Education Level
Disability

Divorced or Separated Comparison

Slavs

Immigrants from Romania

Poor
Exceptional
12.2%
DIVORCED OR SEPARATED
17.0/ 100
METRIC RATING
210th/ 347
METRIC RANK
11.5%
DIVORCED OR SEPARATED
99.3/ 100
METRIC RATING
82nd/ 347
METRIC RANK

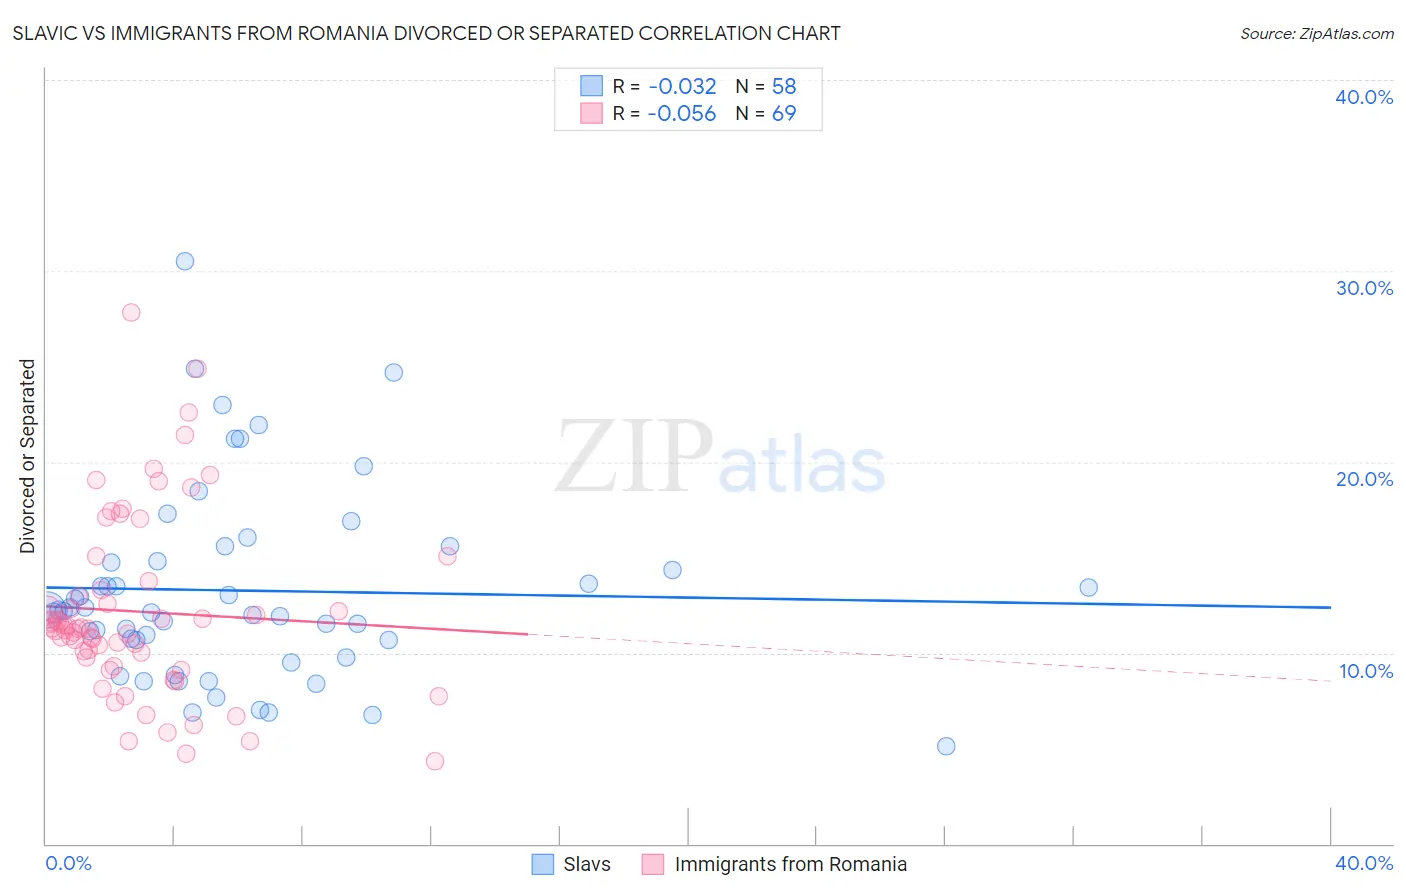
Slavic vs Immigrants from Romania Divorced or Separated Correlation Chart

The statistical analysis conducted on geographies consisting of 270,842,560 people shows no correlation between the proportion of Slavs and percentage of population currently divorced or separated in the United States with a correlation coefficient (R) of -0.032 and weighted average of 12.2%. Similarly, the statistical analysis conducted on geographies consisting of 256,993,939 people shows a slight negative correlation between the proportion of Immigrants from Romania and percentage of population currently divorced or separated in the United States with a correlation coefficient (R) of -0.056 and weighted average of 11.5%, a difference of 6.0%.
Slavic vs Immigrants from Romania Divorced or Separated

Divorced or Separated Correlation Summary

MeasurementSlavicImmigrants from Romania
Minimum5.1%4.3%
Maximum30.5%27.8%
Range25.4%23.5%
Mean13.3%12.2%
Median12.2%11.3%
Interquartile 25% (IQ1)10.6%9.5%
Interquartile 75% (IQ3)14.8%13.5%
Interquartile Range (IQR)4.2%4.0%
Standard Deviation (Sample)5.1%4.7%
Standard Deviation (Population)5.0%4.7%

Similar Demographics by Divorced or Separated

Demographics Similar to Slavs by Divorced or Separated

In terms of divorced or separated, the demographic groups most similar to Slavs are Trinidadian and Tobagonian (12.2%, a difference of 0.020%), Immigrants from Kenya (12.2%, a difference of 0.030%), Immigrants from Trinidad and Tobago (12.2%, a difference of 0.050%), Immigrants from Eastern Africa (12.2%, a difference of 0.050%), and Immigrants from Argentina (12.2%, a difference of 0.090%).
DemographicsRating | RankDivorced or Separated
Immigrants | Guatemala
23.2
/100
|
#203
Fair
12.2%
Kenyans
21.8
/100
|
#204
Fair
12.2%
Immigrants | Costa Rica
21.3
/100
|
#205
Fair
12.2%
Slovaks
21.0
/100
|
#206
Fair
12.2%
Mexicans
21.0
/100
|
#207
Fair
12.2%
Immigrants | Ghana
18.8
/100
|
#208
Poor
12.2%
Immigrants | Trinidad and Tobago
17.8
/100
|
#209
Poor
12.2%
Slavs
17.0
/100
|
#210
Poor
12.2%
Trinidadians and Tobagonians
16.6
/100
|
#211
Poor
12.2%
Immigrants | Kenya
16.5
/100
|
#212
Poor
12.2%
Immigrants | Eastern Africa
16.2
/100
|
#213
Poor
12.2%
Immigrants | Argentina
15.5
/100
|
#214
Poor
12.2%
Europeans
15.4
/100
|
#215
Poor
12.2%
Immigrants | South America
15.4
/100
|
#216
Poor
12.2%
Northern Europeans
14.7
/100
|
#217
Poor
12.2%

Demographics Similar to Immigrants from Romania by Divorced or Separated

In terms of divorced or separated, the demographic groups most similar to Immigrants from Romania are Immigrants from Bulgaria (11.5%, a difference of 0.030%), Bulgarian (11.5%, a difference of 0.050%), Russian (11.5%, a difference of 0.080%), Immigrants from Switzerland (11.5%, a difference of 0.090%), and Guyanese (11.5%, a difference of 0.11%).
DemographicsRating | RankDivorced or Separated
Immigrants | Northern Africa
99.6
/100
|
#75
Exceptional
11.5%
Albanians
99.6
/100
|
#76
Exceptional
11.5%
Immigrants | Italy
99.5
/100
|
#77
Exceptional
11.5%
Afghans
99.4
/100
|
#78
Exceptional
11.5%
Guyanese
99.4
/100
|
#79
Exceptional
11.5%
Immigrants | Switzerland
99.4
/100
|
#80
Exceptional
11.5%
Russians
99.4
/100
|
#81
Exceptional
11.5%
Immigrants | Romania
99.3
/100
|
#82
Exceptional
11.5%
Immigrants | Bulgaria
99.3
/100
|
#83
Exceptional
11.5%
Bulgarians
99.3
/100
|
#84
Exceptional
11.5%
Immigrants | Albania
99.3
/100
|
#85
Exceptional
11.5%
Immigrants | Latvia
99.2
/100
|
#86
Exceptional
11.6%
Immigrants | Nepal
99.2
/100
|
#87
Exceptional
11.6%
Immigrants | Europe
99.2
/100
|
#88
Exceptional
11.6%
Immigrants | Southern Europe
99.1
/100
|
#89
Exceptional
11.6%