Shoshone vs Immigrants from Sri Lanka Family Households

COMPARE

Shoshone
Race
Ancestry
AfghanAfricanAlaska NativeAlaskan AthabascanAlbanianAleutAlsatianAmericanApacheArabArapahoArgentineanArmenianAssyrian/Chaldean/SyriacAustralianAustrianBahamianBangladeshiBarbadianBasqueBelgianBelizeanBermudanBhutaneseBlackfeetBolivianBrazilianBritishBritish West IndianBulgarianBurmeseCajunCambodianCanadianCape VerdeanCarpatho RusynCelticCentral AmericanCentral American IndianCherokeeCheyenneChickasawChileanChineseChippewaChoctawColombianColvilleComancheCosta RicanCreeCreekCroatianCrowCubanCypriotCzechCzechoslovakianDanishDelawareDominicanDutchDutch West IndianEastern EuropeanEcuadorianEgyptianEnglishEstonianEthiopianEuropeanFijianFilipinoFinnishFrenchFrench American IndianFrench CanadianGermanGerman RussianGhanaianGreekGuamanian/ChamorroGuatemalanGuyaneseHaitianHmongHonduranHopiHoumaHungarianIcelanderIndian (Asian)IndonesianInupiatIranianIraqiIrishIroquoisIsraeliItalianJamaicanJapaneseJordanianKenyanKiowaKoreanLaotianLatvianLebaneseLiberianLithuanianLumbeeLuxembourgerMacedonianMalaysianMalteseMarshalleseMenomineeMexicanMexican American IndianMongolianMoroccanNative HawaiianNavajoNepaleseNew ZealanderNicaraguanNigerianNorthern EuropeanNorwegianOkinawanOsageOttawaPaiutePakistaniPalestinianPanamanianParaguayanPennsylvania GermanPeruvianPimaPolishPortuguesePotawatomiPuebloPuerto RicanPuget Sound SalishRomanianRussianSalvadoranSamoanScandinavianScotch-IrishScottishSeminoleSenegaleseSerbianShoshoneSierra LeoneanSiouxSlavicSlovakSloveneSomaliSouth AfricanSouth AmericanSouth American IndianSoviet UnionSpaniardSpanishSpanish AmericanSpanish American IndianSri LankanSubsaharan AfricanSudaneseSwedishSwissSyrianTaiwaneseThaiTlingit-HaidaTohono O'OdhamTonganTrinidadian and TobagonianTsimshianTurkishU.S. Virgin IslanderUgandanUkrainianUruguayanUteVenezuelanVietnameseWelshWest IndianYakamaYaquiYugoslavianYumanYup'ikZimbabwean
Immigration
NonimmigrantsImmigrantsAfghanistanAfricaAlbaniaArgentinaArmeniaAsiaAustraliaAustriaBahamasBangladeshBarbadosBelarusBelgiumBelizeBoliviaBosnia and HerzegovinaBrazilBulgariaBurma/MyanmarCabo VerdeCambodiaCameroonCanadaCaribbeanCentral AmericaChileChinaColombiaCongoCosta RicaCroatiaCubaCzechoslovakiaDenmarkDominicaDominican RepublicEastern AfricaEastern AsiaEastern EuropeEcuadorEgyptEl SalvadorEnglandEritreaEthiopiaEuropeFijiFranceGermanyGhanaGreeceGrenadaGuatemalaGuyanaHaitiHondurasHong KongHungaryIndiaIndonesiaIranIraqIrelandIsraelItalyJamaicaJapanJordanKazakhstanKenyaKoreaKuwaitLaosLatin AmericaLatviaLebanonLiberiaLithuaniaMalaysiaMexicoMicronesiaMiddle AfricaMoldovaMoroccoNepalNetherlandsNicaraguaNigeriaNorth AmericaNorth MacedoniaNorthern AfricaNorthern EuropeNorwayOceaniaPakistanPanamaPeruPhilippinesPolandPortugalRomaniaRussiaSaudi ArabiaScotlandSenegalSerbiaSierra LeoneSingaporeSomaliaSouth AfricaSouth AmericaSouth Central AsiaSouth Eastern AsiaSouthern EuropeSpainSt. Vincent and the GrenadinesSudanSwedenSwitzerlandSyriaTaiwanThailandTrinidad and TobagoTurkeyUgandaUkraineUruguayUzbekistanVenezuelaVietnamWest IndiesWestern AfricaWestern AsiaWestern EuropeYemenZaireZimbabweAzores
Immigrants from Sri Lanka
Race
Ancestry
AfghanAfricanAlaska NativeAlaskan AthabascanAlbanianAleutAlsatianAmericanApacheArabArapahoArgentineanArmenianAssyrian/Chaldean/SyriacAustralianAustrianBahamianBangladeshiBarbadianBasqueBelgianBelizeanBermudanBhutaneseBlackfeetBolivianBrazilianBritishBritish West IndianBulgarianBurmeseCajunCambodianCanadianCape VerdeanCarpatho RusynCelticCentral AmericanCentral American IndianCherokeeCheyenneChickasawChileanChineseChippewaChoctawColombianColvilleComancheCosta RicanCreeCreekCroatianCrowCubanCypriotCzechCzechoslovakianDanishDelawareDominicanDutchDutch West IndianEastern EuropeanEcuadorianEgyptianEnglishEstonianEthiopianEuropeanFijianFilipinoFinnishFrenchFrench American IndianFrench CanadianGermanGerman RussianGhanaianGreekGuamanian/ChamorroGuatemalanGuyaneseHaitianHmongHonduranHopiHoumaHungarianIcelanderIndian (Asian)IndonesianInupiatIranianIraqiIrishIroquoisIsraeliItalianJamaicanJapaneseJordanianKenyanKiowaKoreanLaotianLatvianLebaneseLiberianLithuanianLumbeeLuxembourgerMacedonianMalaysianMalteseMarshalleseMenomineeMexicanMexican American IndianMongolianMoroccanNative HawaiianNavajoNepaleseNew ZealanderNicaraguanNigerianNorthern EuropeanNorwegianOkinawanOsageOttawaPaiutePakistaniPalestinianPanamanianParaguayanPennsylvania GermanPeruvianPimaPolishPortuguesePotawatomiPuebloPuerto RicanPuget Sound SalishRomanianRussianSalvadoranSamoanScandinavianScotch-IrishScottishSeminoleSenegaleseSerbianSierra LeoneanSiouxSlavicSlovakSloveneSomaliSouth AfricanSouth AmericanSouth American IndianSoviet UnionSpaniardSpanishSpanish AmericanSpanish American IndianSri LankanSubsaharan AfricanSudaneseSwedishSwissSyrianTaiwaneseThaiTlingit-HaidaTohono O'OdhamTonganTrinidadian and TobagonianTsimshianTurkishU.S. Virgin IslanderUgandanUkrainianUruguayanUteVenezuelanVietnameseWelshWest IndianYakamaYaquiYugoslavianYumanYup'ikZimbabwean
Immigration
NonimmigrantsImmigrantsAfghanistanAfricaAlbaniaArgentinaArmeniaAsiaAustraliaAustriaBahamasBangladeshBarbadosBelarusBelgiumBelizeBoliviaBosnia and HerzegovinaBrazilBulgariaBurma/MyanmarCabo VerdeCambodiaCameroonCanadaCaribbeanCentral AmericaChileChinaColombiaCongoCosta RicaCroatiaCubaCzechoslovakiaDenmarkDominicaDominican RepublicEastern AfricaEastern AsiaEastern EuropeEcuadorEgyptEl SalvadorEnglandEritreaEthiopiaEuropeFijiFranceGermanyGhanaGreeceGrenadaGuatemalaGuyanaHaitiHondurasHong KongHungaryIndiaIndonesiaIranIraqIrelandIsraelItalyJamaicaJapanJordanKazakhstanKenyaKoreaKuwaitLaosLatin AmericaLatviaLebanonLiberiaLithuaniaMalaysiaMexicoMicronesiaMiddle AfricaMoldovaMoroccoNepalNetherlandsNicaraguaNigeriaNorth AmericaNorth MacedoniaNorthern AfricaNorthern EuropeNorwayOceaniaPakistanPanamaPeruPhilippinesPolandPortugalRomaniaRussiaSaudi ArabiaScotlandSenegalSerbiaSierra LeoneSingaporeSomaliaSouth AfricaSouth AmericaSouth Central AsiaSouth Eastern AsiaSouthern EuropeSpainSri LankaSt. Vincent and the GrenadinesSudanSwedenSwitzerlandSyriaTaiwanThailandTrinidad and TobagoTurkeyUgandaUkraineUruguayUzbekistanVenezuelaVietnamWest IndiesWestern AfricaWestern AsiaWestern EuropeYemenZaireZimbabweAzores
Family Households
Income
Poverty
Unemployment
Labor Participation
Family Structure
Vehicle Availability
Education Level
Disability

Family Households Comparison

Shoshone

Immigrants from Sri Lanka

Tragic
Exceptional
63.8%
FAMILY HOUSEHOLDS
9.4/ 100
METRIC RATING
211th/ 347
METRIC RANK
65.1%
FAMILY HOUSEHOLDS
98.0/ 100
METRIC RATING
102nd/ 347
METRIC RANK

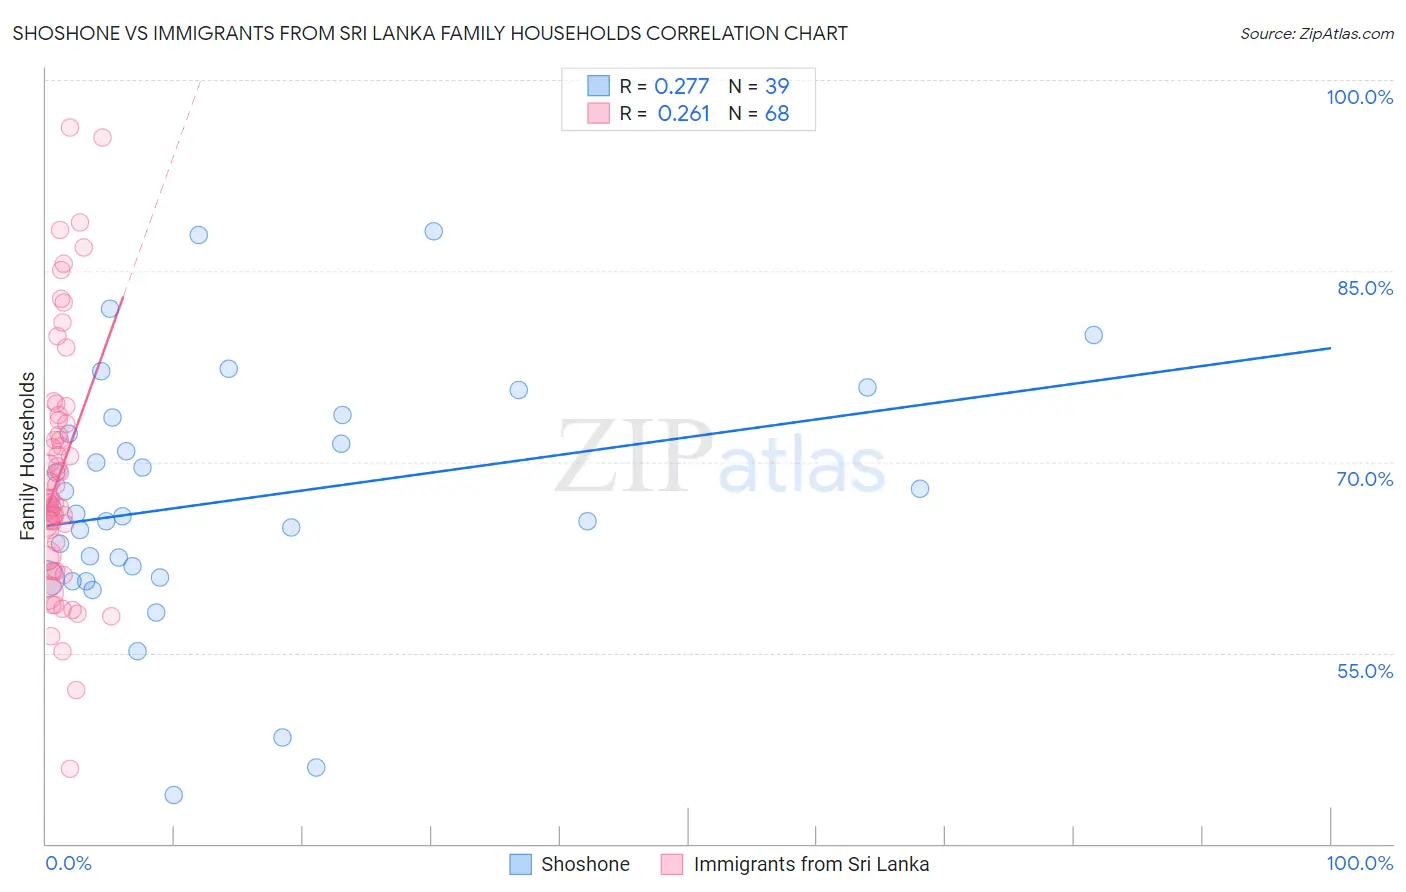
Shoshone vs Immigrants from Sri Lanka Family Households Correlation Chart

The statistical analysis conducted on geographies consisting of 66,615,877 people shows a weak positive correlation between the proportion of Shoshone and percentage of family households in the United States with a correlation coefficient (R) of 0.277 and weighted average of 63.8%. Similarly, the statistical analysis conducted on geographies consisting of 149,689,020 people shows a weak positive correlation between the proportion of Immigrants from Sri Lanka and percentage of family households in the United States with a correlation coefficient (R) of 0.261 and weighted average of 65.1%, a difference of 2.1%.
Shoshone vs Immigrants from Sri Lanka Family Households

Family Households Correlation Summary

MeasurementShoshoneImmigrants from Sri Lanka
Minimum43.8%45.9%
Maximum88.1%96.3%
Range44.3%50.3%
Mean67.0%69.0%
Median65.9%67.0%
Interquartile 25% (IQ1)60.9%62.5%
Interquartile 75% (IQ3)73.5%73.1%
Interquartile Range (IQR)12.6%10.6%
Standard Deviation (Sample)9.8%9.9%
Standard Deviation (Population)9.7%9.8%

Similar Demographics by Family Households

Demographics Similar to Shoshone by Family Households

In terms of family households, the demographic groups most similar to Shoshone are Immigrants from Netherlands (63.8%, a difference of 0.0%), Immigrants from Thailand (63.8%, a difference of 0.010%), Immigrants from Northern Europe (63.8%, a difference of 0.020%), Celtic (63.8%, a difference of 0.060%), and Nigerian (63.9%, a difference of 0.070%).
DemographicsRating | RankFamily Households
Immigrants | Uruguay
12.8
/100
|
#204
Poor
63.9%
Brazilians
12.4
/100
|
#205
Poor
63.9%
Immigrants | Lithuania
12.1
/100
|
#206
Poor
63.9%
Nigerians
11.5
/100
|
#207
Poor
63.9%
Immigrants | Bangladesh
11.4
/100
|
#208
Poor
63.9%
Sierra Leoneans
11.2
/100
|
#209
Poor
63.9%
Immigrants | Thailand
9.6
/100
|
#210
Tragic
63.8%
Shoshone
9.4
/100
|
#211
Tragic
63.8%
Immigrants | Netherlands
9.4
/100
|
#212
Tragic
63.8%
Immigrants | Northern Europe
8.8
/100
|
#213
Tragic
63.8%
Celtics
8.0
/100
|
#214
Tragic
63.8%
Belgians
7.6
/100
|
#215
Tragic
63.8%
Croatians
7.3
/100
|
#216
Tragic
63.8%
Osage
7.0
/100
|
#217
Tragic
63.7%
Marshallese
6.9
/100
|
#218
Tragic
63.7%

Demographics Similar to Immigrants from Sri Lanka by Family Households

In terms of family households, the demographic groups most similar to Immigrants from Sri Lanka are Haitian (65.2%, a difference of 0.020%), Chilean (65.2%, a difference of 0.020%), Indian (Asian) (65.1%, a difference of 0.020%), Spaniard (65.1%, a difference of 0.020%), and Central American Indian (65.2%, a difference of 0.060%).
DemographicsRating | RankFamily Households
Immigrants | Portugal
98.6
/100
|
#95
Exceptional
65.2%
Swiss
98.6
/100
|
#96
Exceptional
65.2%
Guatemalans
98.6
/100
|
#97
Exceptional
65.2%
Immigrants | Syria
98.4
/100
|
#98
Exceptional
65.2%
Central American Indians
98.3
/100
|
#99
Exceptional
65.2%
Haitians
98.1
/100
|
#100
Exceptional
65.2%
Chileans
98.1
/100
|
#101
Exceptional
65.2%
Immigrants | Sri Lanka
98.0
/100
|
#102
Exceptional
65.1%
Indians (Asian)
97.9
/100
|
#103
Exceptional
65.1%
Spaniards
97.8
/100
|
#104
Exceptional
65.1%
English
97.4
/100
|
#105
Exceptional
65.1%
Whites/Caucasians
97.3
/100
|
#106
Exceptional
65.1%
Alaska Natives
97.3
/100
|
#107
Exceptional
65.1%
Palestinians
97.2
/100
|
#108
Exceptional
65.1%
Immigrants | Guatemala
96.9
/100
|
#109
Exceptional
65.0%