Scandinavian vs Scottish Family Households
COMPARE
Scandinavian
Scottish
Family Households
Family Households Comparison
Scandinavians
Scottish
65.0%
FAMILY HOUSEHOLDS
96.8/ 100
METRIC RATING
110th/ 347
METRIC RANK
64.5%
FAMILY HOUSEHOLDS
70.9/ 100
METRIC RATING
152nd/ 347
METRIC RANK
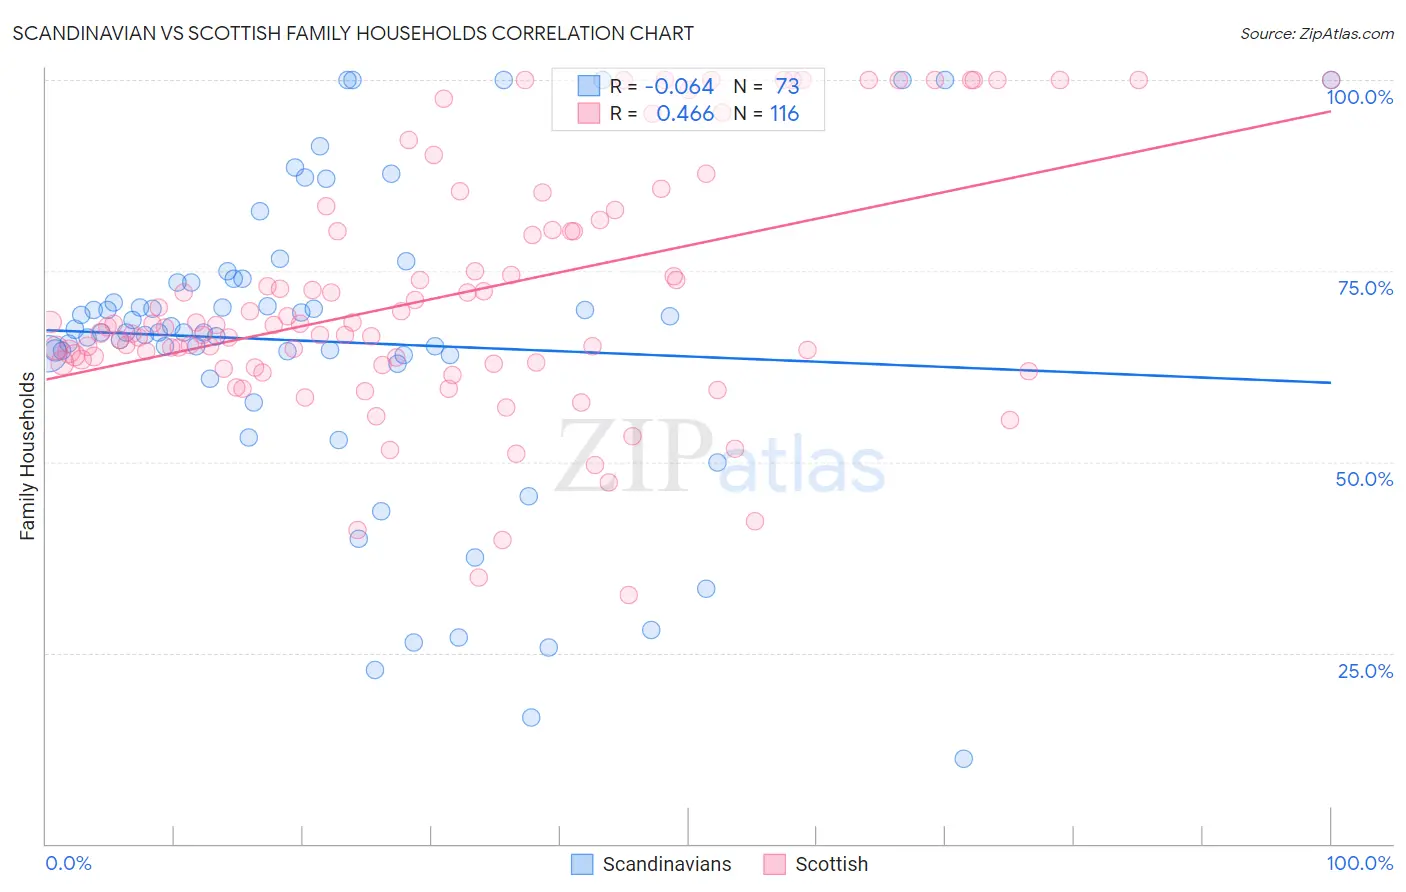
Scandinavian vs Scottish Family Households Correlation Chart
The statistical analysis conducted on geographies consisting of 472,285,900 people shows a slight negative correlation between the proportion of Scandinavians and percentage of family households in the United States with a correlation coefficient (R) of -0.064 and weighted average of 65.0%. Similarly, the statistical analysis conducted on geographies consisting of 566,567,551 people shows a moderate positive correlation between the proportion of Scottish and percentage of family households in the United States with a correlation coefficient (R) of 0.466 and weighted average of 64.5%, a difference of 0.85%.
Family Households Correlation Summary
| Measurement | Scandinavian | Scottish |
| Minimum | 11.1% | 32.6% |
| Maximum | 100.0% | 100.0% |
| Range | 88.9% | 67.4% |
| Mean | 65.7% | 71.9% |
| Median | 67.0% | 67.9% |
| Interquartile 25% (IQ1) | 63.4% | 63.0% |
| Interquartile 75% (IQ3) | 73.7% | 80.9% |
| Interquartile Range (IQR) | 10.3% | 18.0% |
| Standard Deviation (Sample) | 20.2% | 16.1% |
| Standard Deviation (Population) | 20.0% | 16.1% |
Similar Demographics by Family Households
Demographics Similar to Scandinavians by Family Households
In terms of family households, the demographic groups most similar to Scandinavians are European (65.0%, a difference of 0.0%), Immigrants from Guatemala (65.0%, a difference of 0.010%), Immigrants from Jordan (65.0%, a difference of 0.040%), Palestinian (65.1%, a difference of 0.050%), and White/Caucasian (65.1%, a difference of 0.060%).
| Demographics | Rating | Rank | Family Households |
| Indians (Asian) | 97.9 /100 | #103 | Exceptional 65.1% |
| Spaniards | 97.8 /100 | #104 | Exceptional 65.1% |
| English | 97.4 /100 | #105 | Exceptional 65.1% |
| Whites/Caucasians | 97.3 /100 | #106 | Exceptional 65.1% |
| Alaska Natives | 97.3 /100 | #107 | Exceptional 65.1% |
| Palestinians | 97.2 /100 | #108 | Exceptional 65.1% |
| Immigrants | Guatemala | 96.9 /100 | #109 | Exceptional 65.0% |
| Scandinavians | 96.8 /100 | #110 | Exceptional 65.0% |
| Europeans | 96.8 /100 | #111 | Exceptional 65.0% |
| Immigrants | Jordan | 96.5 /100 | #112 | Exceptional 65.0% |
| Spanish | 96.2 /100 | #113 | Exceptional 65.0% |
| Argentineans | 95.7 /100 | #114 | Exceptional 65.0% |
| Ecuadorians | 95.4 /100 | #115 | Exceptional 65.0% |
| Immigrants | Iraq | 95.4 /100 | #116 | Exceptional 65.0% |
| Cherokee | 95.3 /100 | #117 | Exceptional 65.0% |
Demographics Similar to Scottish by Family Households
In terms of family households, the demographic groups most similar to Scottish are Swedish (64.5%, a difference of 0.020%), Austrian (64.5%, a difference of 0.040%), Uruguayan (64.5%, a difference of 0.050%), Czech (64.5%, a difference of 0.060%), and Romanian (64.5%, a difference of 0.070%).
| Demographics | Rating | Rank | Family Households |
| Welsh | 80.1 /100 | #145 | Excellent 64.6% |
| Immigrants | Romania | 77.0 /100 | #146 | Good 64.6% |
| Immigrants | Chile | 76.5 /100 | #147 | Good 64.6% |
| Delaware | 76.3 /100 | #148 | Good 64.6% |
| Sioux | 76.3 /100 | #149 | Good 64.6% |
| Romanians | 75.3 /100 | #150 | Good 64.5% |
| Syrians | 75.2 /100 | #151 | Good 64.5% |
| Scottish | 70.9 /100 | #152 | Good 64.5% |
| Swedes | 69.8 /100 | #153 | Good 64.5% |
| Austrians | 68.5 /100 | #154 | Good 64.5% |
| Uruguayans | 67.7 /100 | #155 | Good 64.5% |
| Czechs | 67.0 /100 | #156 | Good 64.5% |
| Canadians | 66.6 /100 | #157 | Good 64.4% |
| Lebanese | 66.4 /100 | #158 | Good 64.4% |
| Germans | 65.8 /100 | #159 | Good 64.4% |