Scandinavian vs Colville Single Father Households
COMPARE
Scandinavian
Colville
Single Father Households
Single Father Households Comparison
Scandinavians
Colville
2.4%
SINGLE FATHER HOUSEHOLDS
27.4/ 100
METRIC RATING
198th/ 347
METRIC RANK
3.3%
SINGLE FATHER HOUSEHOLDS
0.0/ 100
METRIC RATING
335th/ 347
METRIC RANK
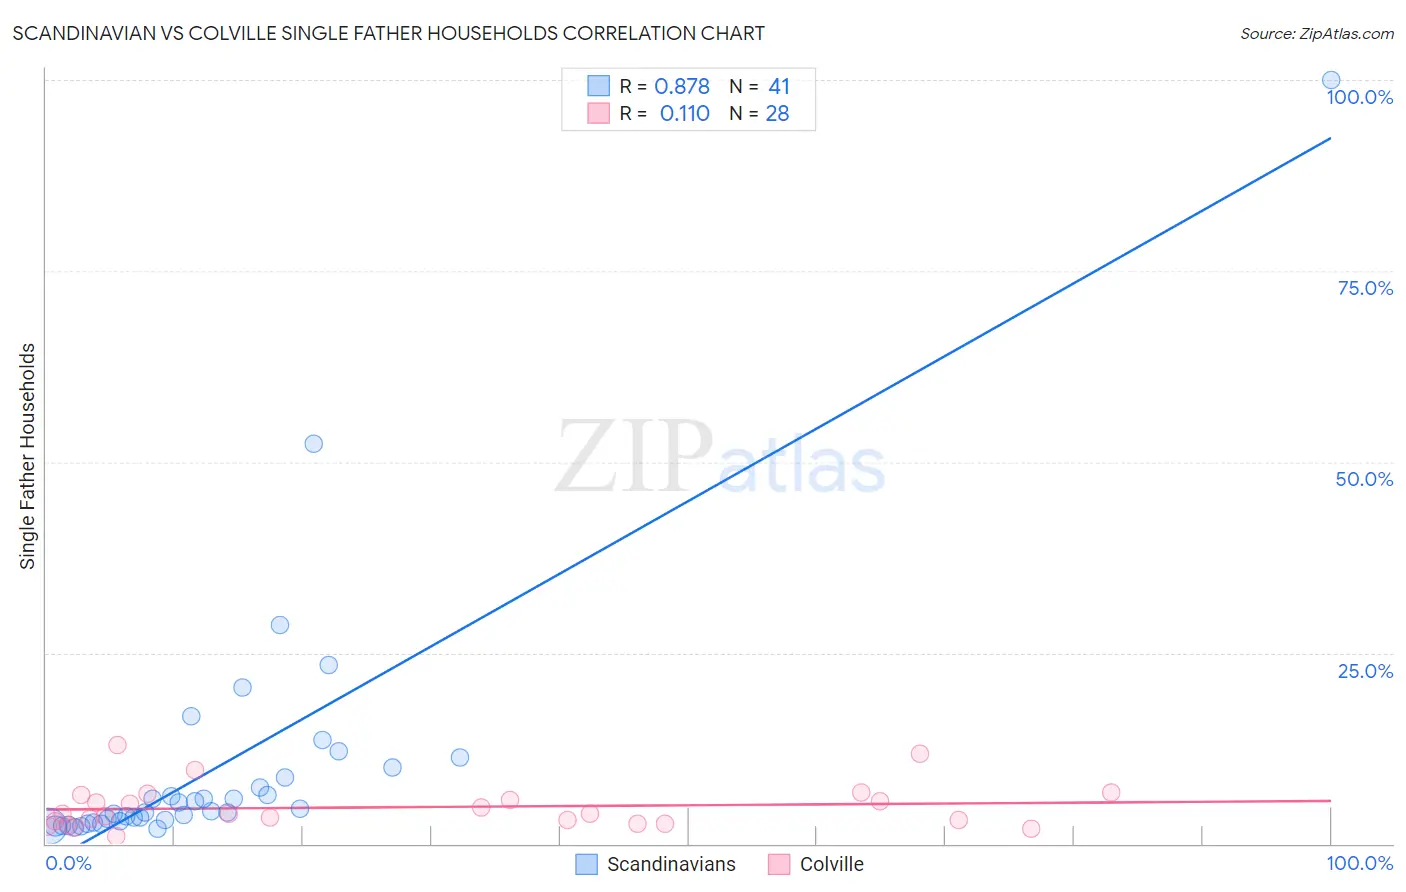
Scandinavian vs Colville Single Father Households Correlation Chart
The statistical analysis conducted on geographies consisting of 465,605,618 people shows a very strong positive correlation between the proportion of Scandinavians and percentage of single father households in the United States with a correlation coefficient (R) of 0.878 and weighted average of 2.4%. Similarly, the statistical analysis conducted on geographies consisting of 34,617,249 people shows a poor positive correlation between the proportion of Colville and percentage of single father households in the United States with a correlation coefficient (R) of 0.110 and weighted average of 3.3%, a difference of 38.5%.
Single Father Households Correlation Summary
| Measurement | Scandinavian | Colville |
| Minimum | 1.9% | 1.0% |
| Maximum | 100.0% | 12.9% |
| Range | 98.1% | 11.9% |
| Mean | 10.1% | 4.8% |
| Median | 4.3% | 4.0% |
| Interquartile 25% (IQ1) | 2.9% | 2.8% |
| Interquartile 75% (IQ3) | 9.3% | 6.0% |
| Interquartile Range (IQR) | 6.5% | 3.2% |
| Standard Deviation (Sample) | 17.2% | 2.9% |
| Standard Deviation (Population) | 16.9% | 2.8% |
Similar Demographics by Single Father Households
Demographics Similar to Scandinavians by Single Father Households
In terms of single father households, the demographic groups most similar to Scandinavians are Immigrants from Vietnam (2.4%, a difference of 0.030%), Peruvian (2.4%, a difference of 0.030%), German (2.4%, a difference of 0.050%), Kenyan (2.4%, a difference of 0.060%), and Immigrants from Philippines (2.4%, a difference of 0.11%).
| Demographics | Rating | Rank | Single Father Households |
| Immigrants | Africa | 30.0 /100 | #191 | Fair 2.4% |
| Immigrants | Sudan | 29.8 /100 | #192 | Fair 2.4% |
| Uruguayans | 29.7 /100 | #193 | Fair 2.4% |
| Panamanians | 29.6 /100 | #194 | Fair 2.4% |
| Immigrants | Philippines | 28.7 /100 | #195 | Fair 2.4% |
| Kenyans | 28.0 /100 | #196 | Fair 2.4% |
| Germans | 28.0 /100 | #197 | Fair 2.4% |
| Scandinavians | 27.4 /100 | #198 | Fair 2.4% |
| Immigrants | Vietnam | 27.1 /100 | #199 | Fair 2.4% |
| Peruvians | 27.1 /100 | #200 | Fair 2.4% |
| Immigrants | Uganda | 26.0 /100 | #201 | Fair 2.4% |
| German Russians | 25.7 /100 | #202 | Fair 2.4% |
| French Canadians | 24.7 /100 | #203 | Fair 2.4% |
| Ecuadorians | 24.5 /100 | #204 | Fair 2.4% |
| Immigrants | Afghanistan | 24.2 /100 | #205 | Fair 2.4% |
Demographics Similar to Colville by Single Father Households
In terms of single father households, the demographic groups most similar to Colville are Yuman (3.3%, a difference of 0.020%), Paiute (3.3%, a difference of 0.030%), Pueblo (3.3%, a difference of 0.28%), Sioux (3.3%, a difference of 0.96%), and Alaskan Athabascan (3.4%, a difference of 2.4%).
| Demographics | Rating | Rank | Single Father Households |
| Immigrants | Cabo Verde | 0.0 /100 | #328 | Tragic 3.1% |
| Chippewa | 0.0 /100 | #329 | Tragic 3.1% |
| Nepalese | 0.0 /100 | #330 | Tragic 3.1% |
| Navajo | 0.0 /100 | #331 | Tragic 3.2% |
| Yaqui | 0.0 /100 | #332 | Tragic 3.2% |
| Natives/Alaskans | 0.0 /100 | #333 | Tragic 3.2% |
| Yuman | 0.0 /100 | #334 | Tragic 3.3% |
| Colville | 0.0 /100 | #335 | Tragic 3.3% |
| Paiute | 0.0 /100 | #336 | Tragic 3.3% |
| Pueblo | 0.0 /100 | #337 | Tragic 3.3% |
| Sioux | 0.0 /100 | #338 | Tragic 3.3% |
| Alaskan Athabascans | 0.0 /100 | #339 | Tragic 3.4% |
| Alaska Natives | 0.0 /100 | #340 | Tragic 3.5% |
| Crow | 0.0 /100 | #341 | Tragic 3.5% |
| Tohono O'odham | 0.0 /100 | #342 | Tragic 3.8% |