Salvadoran vs Immigrants from Eastern Africa Currently Married
COMPARE
Salvadoran
Immigrants from Eastern Africa
Currently Married
Currently Married Comparison
Salvadorans
Immigrants from Eastern Africa
43.5%
CURRENTLY MARRIED
0.1/ 100
METRIC RATING
270th/ 347
METRIC RANK
44.2%
CURRENTLY MARRIED
0.3/ 100
METRIC RATING
250th/ 347
METRIC RANK
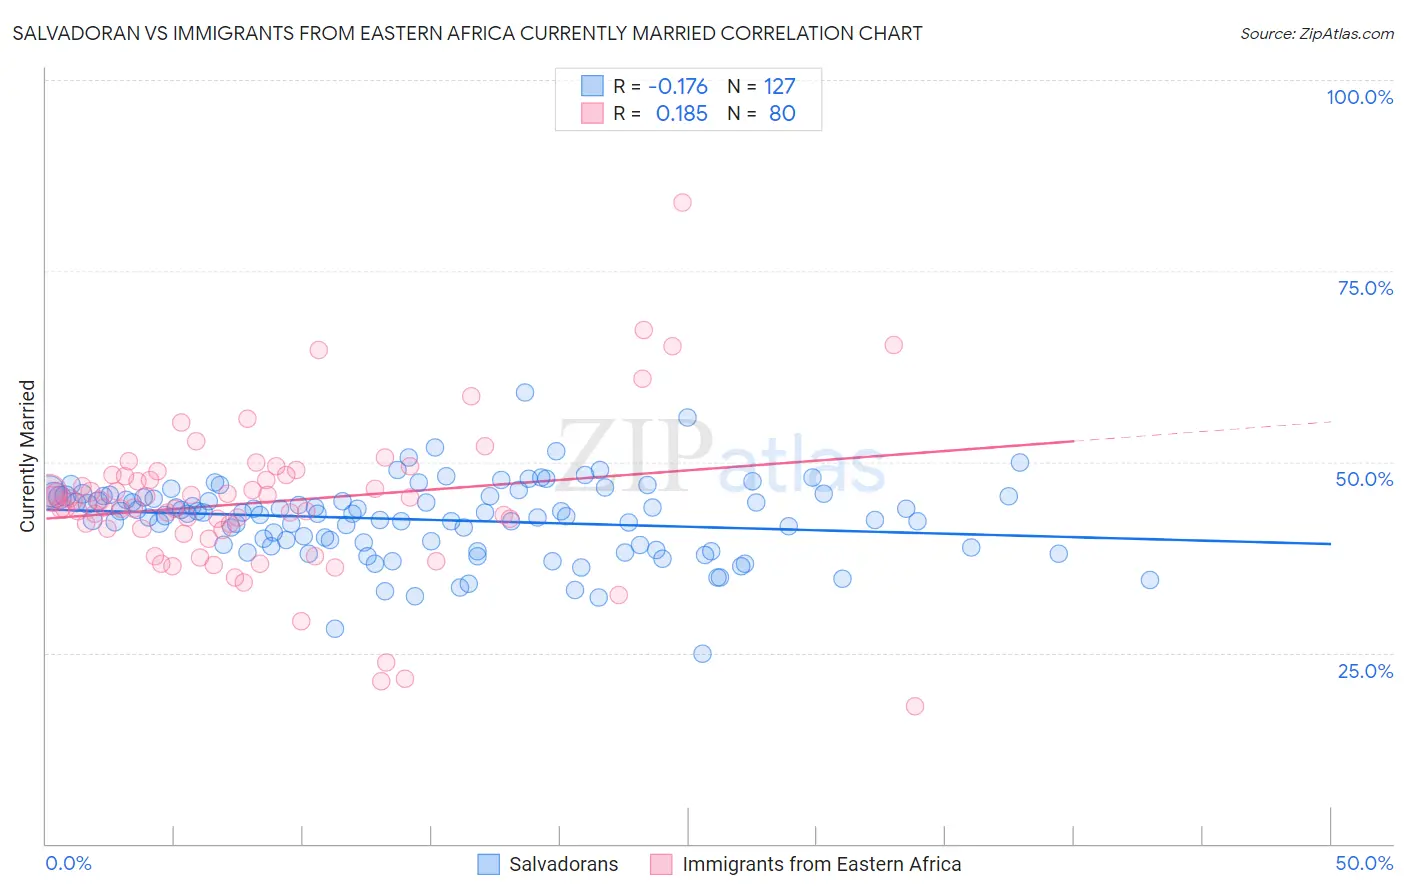
Salvadoran vs Immigrants from Eastern Africa Currently Married Correlation Chart
The statistical analysis conducted on geographies consisting of 399,003,710 people shows a poor negative correlation between the proportion of Salvadorans and percentage of population currently married in the United States with a correlation coefficient (R) of -0.176 and weighted average of 43.5%. Similarly, the statistical analysis conducted on geographies consisting of 355,130,503 people shows a poor positive correlation between the proportion of Immigrants from Eastern Africa and percentage of population currently married in the United States with a correlation coefficient (R) of 0.185 and weighted average of 44.2%, a difference of 1.6%.
Currently Married Correlation Summary
| Measurement | Salvadoran | Immigrants from Eastern Africa |
| Minimum | 24.9% | 18.0% |
| Maximum | 59.1% | 83.9% |
| Range | 34.2% | 65.9% |
| Mean | 42.4% | 44.7% |
| Median | 43.2% | 44.4% |
| Interquartile 25% (IQ1) | 39.1% | 41.2% |
| Interquartile 75% (IQ3) | 45.5% | 48.2% |
| Interquartile Range (IQR) | 6.4% | 7.0% |
| Standard Deviation (Sample) | 5.1% | 10.0% |
| Standard Deviation (Population) | 5.0% | 9.9% |
Demographics Similar to Salvadorans and Immigrants from Eastern Africa by Currently Married
In terms of currently married, the demographic groups most similar to Salvadorans are Immigrants from Sudan (43.5%, a difference of 0.080%), Spanish American Indian (43.6%, a difference of 0.20%), Immigrants from Eritrea (43.6%, a difference of 0.21%), Ecuadorian (43.6%, a difference of 0.24%), and Immigrants from Bangladesh (43.6%, a difference of 0.30%). Similarly, the demographic groups most similar to Immigrants from Eastern Africa are Blackfeet (44.2%, a difference of 0.060%), Hispanic or Latino (44.1%, a difference of 0.080%), Immigrants from Central America (44.1%, a difference of 0.12%), Vietnamese (44.0%, a difference of 0.36%), and Yakama (44.0%, a difference of 0.43%).
| Demographics | Rating | Rank | Currently Married |
| Immigrants | Eastern Africa | 0.3 /100 | #250 | Tragic 44.2% |
| Blackfeet | 0.3 /100 | #251 | Tragic 44.2% |
| Hispanics or Latinos | 0.3 /100 | #252 | Tragic 44.1% |
| Immigrants | Central America | 0.3 /100 | #253 | Tragic 44.1% |
| Vietnamese | 0.2 /100 | #254 | Tragic 44.0% |
| Yakama | 0.2 /100 | #255 | Tragic 44.0% |
| Shoshone | 0.2 /100 | #256 | Tragic 44.0% |
| Immigrants | Africa | 0.2 /100 | #257 | Tragic 43.9% |
| Ute | 0.2 /100 | #258 | Tragic 43.9% |
| Immigrants | Sierra Leone | 0.1 /100 | #259 | Tragic 43.8% |
| Immigrants | Latin America | 0.1 /100 | #260 | Tragic 43.8% |
| Immigrants | Nicaragua | 0.1 /100 | #261 | Tragic 43.7% |
| Bangladeshis | 0.1 /100 | #262 | Tragic 43.7% |
| Immigrants | Cuba | 0.1 /100 | #263 | Tragic 43.7% |
| Sudanese | 0.1 /100 | #264 | Tragic 43.7% |
| Immigrants | Bangladesh | 0.1 /100 | #265 | Tragic 43.6% |
| Ecuadorians | 0.1 /100 | #266 | Tragic 43.6% |
| Immigrants | Eritrea | 0.1 /100 | #267 | Tragic 43.6% |
| Spanish American Indians | 0.1 /100 | #268 | Tragic 43.6% |
| Immigrants | Sudan | 0.1 /100 | #269 | Tragic 43.5% |
| Salvadorans | 0.1 /100 | #270 | Tragic 43.5% |