Romanian vs Aleut Divorced or Separated

COMPARE

Romanian
Race
Ancestry
AfghanAfricanAlaska NativeAlaskan AthabascanAlbanianAlsatianAmericanApacheArabArapahoArgentineanArmenianAssyrian/Chaldean/SyriacAustralianAustrianBahamianBangladeshiBarbadianBasqueBelgianBelizeanBermudanBhutaneseBlackfeetBolivianBrazilianBritishBritish West IndianBulgarianBurmeseCajunCambodianCanadianCape VerdeanCarpatho RusynCelticCentral AmericanCentral American IndianCherokeeCheyenneChickasawChileanChineseChippewaChoctawColombianColvilleComancheCosta RicanCreeCreekCroatianCrowCubanCypriotCzechCzechoslovakianDanishDelawareDominicanDutchDutch West IndianEastern EuropeanEcuadorianEgyptianEnglishEstonianEthiopianEuropeanFijianFilipinoFinnishFrenchFrench American IndianFrench CanadianGermanGerman RussianGhanaianGreekGuamanian/ChamorroGuatemalanGuyaneseHaitianHmongHonduranHopiHoumaHungarianIcelanderIndian (Asian)IndonesianInupiatIranianIraqiIrishIroquoisIsraeliItalianJamaicanJapaneseJordanianKenyanKiowaKoreanLaotianLatvianLebaneseLiberianLithuanianLumbeeLuxembourgerMacedonianMalaysianMalteseMarshalleseMenomineeMexicanMexican American IndianMongolianMoroccanNative HawaiianNavajoNepaleseNew ZealanderNicaraguanNigerianNorthern EuropeanNorwegianOkinawanOsageOttawaPaiutePakistaniPalestinianPanamanianParaguayanPennsylvania GermanPeruvianPimaPolishPortuguesePotawatomiPuebloPuerto RicanPuget Sound SalishRomanianRussianSalvadoranSamoanScandinavianScotch-IrishScottishSeminoleSenegaleseSerbianShoshoneSierra LeoneanSiouxSlavicSlovakSloveneSomaliSouth AfricanSouth AmericanSouth American IndianSoviet UnionSpaniardSpanishSpanish AmericanSpanish American IndianSri LankanSubsaharan AfricanSudaneseSwedishSwissSyrianTaiwaneseThaiTlingit-HaidaTohono O'OdhamTonganTrinidadian and TobagonianTsimshianTurkishU.S. Virgin IslanderUgandanUkrainianUruguayanUteVenezuelanVietnameseWelshWest IndianYakamaYaquiYugoslavianYumanYup'ikZimbabwean
Immigration
NonimmigrantsImmigrantsAfghanistanAfricaAlbaniaArgentinaArmeniaAsiaAustraliaAustriaBahamasBangladeshBarbadosBelarusBelgiumBelizeBoliviaBosnia and HerzegovinaBrazilBulgariaBurma/MyanmarCabo VerdeCambodiaCameroonCanadaCaribbeanCentral AmericaChileChinaColombiaCongoCosta RicaCroatiaCubaCzechoslovakiaDenmarkDominicaDominican RepublicEastern AfricaEastern AsiaEastern EuropeEcuadorEgyptEl SalvadorEnglandEritreaEthiopiaEuropeFijiFranceGermanyGhanaGreeceGrenadaGuatemalaGuyanaHaitiHondurasHong KongHungaryIndiaIndonesiaIranIraqIrelandIsraelItalyJamaicaJapanJordanKazakhstanKenyaKoreaKuwaitLaosLatin AmericaLatviaLebanonLiberiaLithuaniaMalaysiaMexicoMicronesiaMiddle AfricaMoldovaMoroccoNepalNetherlandsNicaraguaNigeriaNorth AmericaNorth MacedoniaNorthern AfricaNorthern EuropeNorwayOceaniaPakistanPanamaPeruPhilippinesPolandPortugalRomaniaRussiaSaudi ArabiaScotlandSenegalSerbiaSierra LeoneSingaporeSomaliaSouth AfricaSouth AmericaSouth Central AsiaSouth Eastern AsiaSouthern EuropeSpainSri LankaSt. Vincent and the GrenadinesSudanSwedenSwitzerlandSyriaTaiwanThailandTrinidad and TobagoTurkeyUgandaUkraineUruguayUzbekistanVenezuelaVietnamWest IndiesWestern AfricaWestern AsiaWestern EuropeYemenZaireZimbabweAzores
Aleut
Race
Ancestry
AfghanAfricanAlaska NativeAlaskan AthabascanAlbanianAleutAlsatianAmericanApacheArabArapahoArgentineanArmenianAssyrian/Chaldean/SyriacAustralianAustrianBahamianBangladeshiBarbadianBasqueBelgianBelizeanBermudanBhutaneseBlackfeetBolivianBrazilianBritishBritish West IndianBulgarianBurmeseCajunCambodianCanadianCape VerdeanCarpatho RusynCelticCentral AmericanCentral American IndianCherokeeCheyenneChickasawChileanChineseChippewaChoctawColombianColvilleComancheCosta RicanCreeCreekCroatianCrowCubanCypriotCzechCzechoslovakianDanishDelawareDominicanDutchDutch West IndianEastern EuropeanEcuadorianEgyptianEnglishEstonianEthiopianEuropeanFijianFilipinoFinnishFrenchFrench American IndianFrench CanadianGermanGerman RussianGhanaianGreekGuamanian/ChamorroGuatemalanGuyaneseHaitianHmongHonduranHopiHoumaHungarianIcelanderIndian (Asian)IndonesianInupiatIranianIraqiIrishIroquoisIsraeliItalianJamaicanJapaneseJordanianKenyanKiowaKoreanLaotianLatvianLebaneseLiberianLithuanianLumbeeLuxembourgerMacedonianMalaysianMalteseMarshalleseMenomineeMexicanMexican American IndianMongolianMoroccanNative HawaiianNavajoNepaleseNew ZealanderNicaraguanNigerianNorthern EuropeanNorwegianOkinawanOsageOttawaPaiutePakistaniPalestinianPanamanianParaguayanPennsylvania GermanPeruvianPimaPolishPortuguesePotawatomiPuebloPuerto RicanPuget Sound SalishRussianSalvadoranSamoanScandinavianScotch-IrishScottishSeminoleSenegaleseSerbianShoshoneSierra LeoneanSiouxSlavicSlovakSloveneSomaliSouth AfricanSouth AmericanSouth American IndianSoviet UnionSpaniardSpanishSpanish AmericanSpanish American IndianSri LankanSubsaharan AfricanSudaneseSwedishSwissSyrianTaiwaneseThaiTlingit-HaidaTohono O'OdhamTonganTrinidadian and TobagonianTsimshianTurkishU.S. Virgin IslanderUgandanUkrainianUruguayanUteVenezuelanVietnameseWelshWest IndianYakamaYaquiYugoslavianYumanYup'ikZimbabwean
Immigration
NonimmigrantsImmigrantsAfghanistanAfricaAlbaniaArgentinaArmeniaAsiaAustraliaAustriaBahamasBangladeshBarbadosBelarusBelgiumBelizeBoliviaBosnia and HerzegovinaBrazilBulgariaBurma/MyanmarCabo VerdeCambodiaCameroonCanadaCaribbeanCentral AmericaChileChinaColombiaCongoCosta RicaCroatiaCubaCzechoslovakiaDenmarkDominicaDominican RepublicEastern AfricaEastern AsiaEastern EuropeEcuadorEgyptEl SalvadorEnglandEritreaEthiopiaEuropeFijiFranceGermanyGhanaGreeceGrenadaGuatemalaGuyanaHaitiHondurasHong KongHungaryIndiaIndonesiaIranIraqIrelandIsraelItalyJamaicaJapanJordanKazakhstanKenyaKoreaKuwaitLaosLatin AmericaLatviaLebanonLiberiaLithuaniaMalaysiaMexicoMicronesiaMiddle AfricaMoldovaMoroccoNepalNetherlandsNicaraguaNigeriaNorth AmericaNorth MacedoniaNorthern AfricaNorthern EuropeNorwayOceaniaPakistanPanamaPeruPhilippinesPolandPortugalRomaniaRussiaSaudi ArabiaScotlandSenegalSerbiaSierra LeoneSingaporeSomaliaSouth AfricaSouth AmericaSouth Central AsiaSouth Eastern AsiaSouthern EuropeSpainSri LankaSt. Vincent and the GrenadinesSudanSwedenSwitzerlandSyriaTaiwanThailandTrinidad and TobagoTurkeyUgandaUkraineUruguayUzbekistanVenezuelaVietnamWest IndiesWestern AfricaWestern AsiaWestern EuropeYemenZaireZimbabweAzores
Divorced or Separated
Income
Poverty
Unemployment
Labor Participation
Family Structure
Vehicle Availability
Education Level
Disability

Divorced or Separated Comparison

Romanians

Aleuts

Exceptional
Tragic
11.8%
DIVORCED OR SEPARATED
94.5/ 100
METRIC RATING
121st/ 347
METRIC RANK
12.5%
DIVORCED OR SEPARATED
1.3/ 100
METRIC RATING
251st/ 347
METRIC RANK

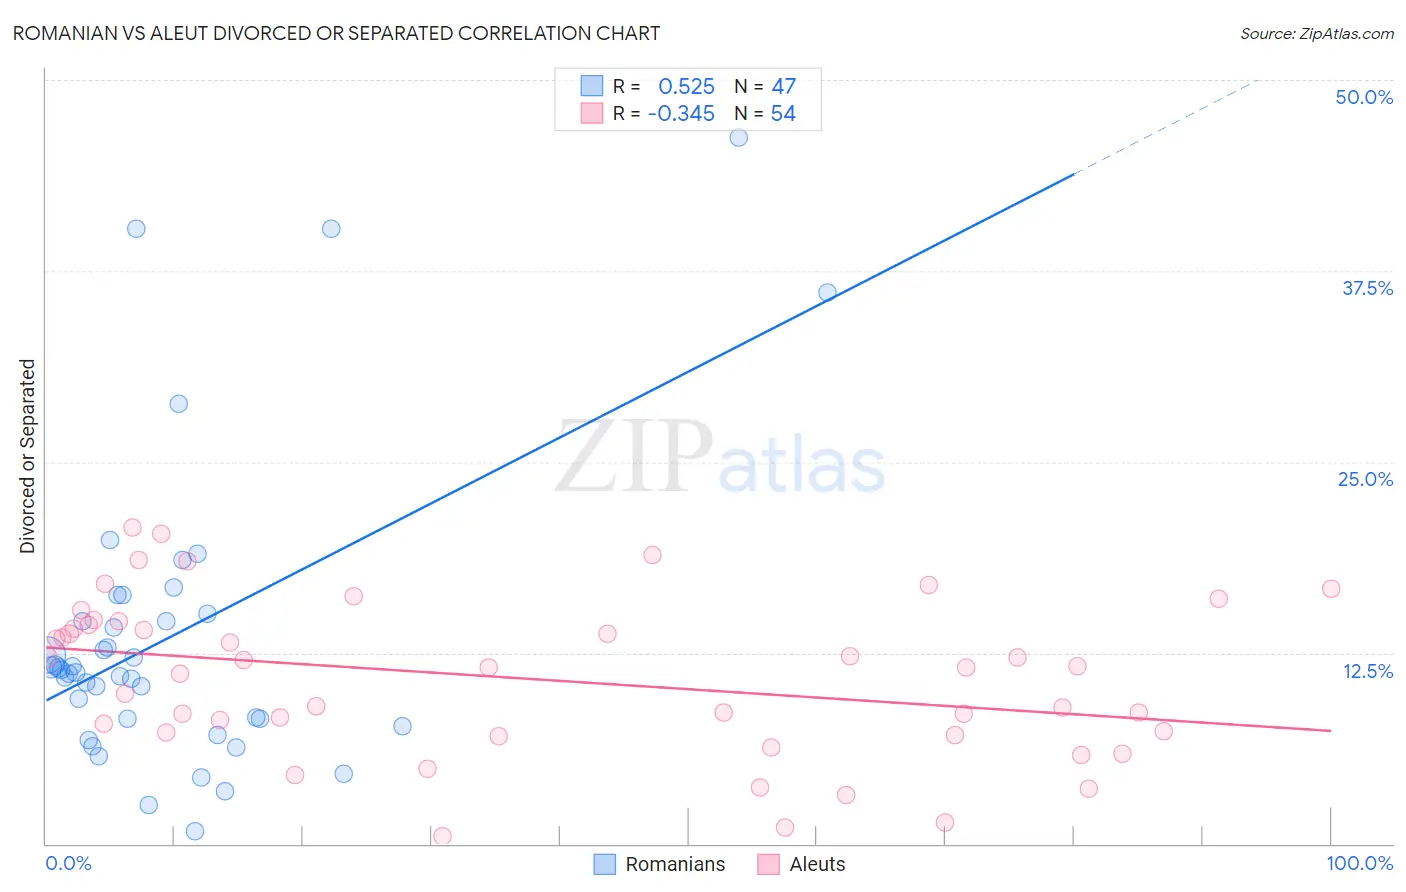
Romanian vs Aleut Divorced or Separated Correlation Chart

The statistical analysis conducted on geographies consisting of 377,785,427 people shows a substantial positive correlation between the proportion of Romanians and percentage of population currently divorced or separated in the United States with a correlation coefficient (R) of 0.525 and weighted average of 11.8%. Similarly, the statistical analysis conducted on geographies consisting of 61,777,142 people shows a mild negative correlation between the proportion of Aleuts and percentage of population currently divorced or separated in the United States with a correlation coefficient (R) of -0.345 and weighted average of 12.5%, a difference of 6.4%.
Romanian vs Aleut Divorced or Separated

Divorced or Separated Correlation Summary

MeasurementRomanianAleut
Minimum0.80%0.50%
Maximum46.2%20.7%
Range45.4%20.2%
Mean13.6%10.8%
Median11.4%11.5%
Interquartile 25% (IQ1)8.2%7.3%
Interquartile 75% (IQ3)15.0%14.3%
Interquartile Range (IQR)6.8%7.0%
Standard Deviation (Sample)9.8%5.1%
Standard Deviation (Population)9.7%5.0%

Similar Demographics by Divorced or Separated

Demographics Similar to Romanians by Divorced or Separated

In terms of divorced or separated, the demographic groups most similar to Romanians are Iraqi (11.8%, a difference of 0.010%), Syrian (11.7%, a difference of 0.10%), Menominee (11.8%, a difference of 0.12%), Immigrants (11.8%, a difference of 0.13%), and Ecuadorian (11.7%, a difference of 0.14%).
DemographicsRating | RankDivorced or Separated
Immigrants | Norway
95.9
/100
|
#114
Exceptional
11.7%
Lithuanians
95.7
/100
|
#115
Exceptional
11.7%
Immigrants | Iraq
95.4
/100
|
#116
Exceptional
11.7%
Immigrants | Uganda
95.3
/100
|
#117
Exceptional
11.7%
Ecuadorians
95.3
/100
|
#118
Exceptional
11.7%
Syrians
95.1
/100
|
#119
Exceptional
11.7%
Iraqis
94.6
/100
|
#120
Exceptional
11.8%
Romanians
94.5
/100
|
#121
Exceptional
11.8%
Menominee
93.8
/100
|
#122
Exceptional
11.8%
Immigrants | Immigrants
93.7
/100
|
#123
Exceptional
11.8%
Ugandans
93.1
/100
|
#124
Exceptional
11.8%
Ukrainians
92.3
/100
|
#125
Exceptional
11.8%
South American Indians
92.1
/100
|
#126
Exceptional
11.8%
South Africans
88.9
/100
|
#127
Excellent
11.8%
Immigrants | Ecuador
88.9
/100
|
#128
Excellent
11.8%

Demographics Similar to Aleuts by Divorced or Separated

In terms of divorced or separated, the demographic groups most similar to Aleuts are Irish (12.5%, a difference of 0.0%), Finnish (12.5%, a difference of 0.28%), Nepalese (12.5%, a difference of 0.29%), German (12.5%, a difference of 0.31%), and Liberian (12.6%, a difference of 0.33%).
DemographicsRating | RankDivorced or Separated
Alaska Natives
2.5
/100
|
#244
Tragic
12.4%
Hispanics or Latinos
2.0
/100
|
#245
Tragic
12.5%
Immigrants | West Indies
1.9
/100
|
#246
Tragic
12.5%
Germans
1.8
/100
|
#247
Tragic
12.5%
Nepalese
1.8
/100
|
#248
Tragic
12.5%
Finns
1.8
/100
|
#249
Tragic
12.5%
Irish
1.3
/100
|
#250
Tragic
12.5%
Aleuts
1.3
/100
|
#251
Tragic
12.5%
Liberians
0.9
/100
|
#252
Tragic
12.6%
Somalis
0.9
/100
|
#253
Tragic
12.6%
Senegalese
0.8
/100
|
#254
Tragic
12.6%
Welsh
0.7
/100
|
#255
Tragic
12.6%
Immigrants | Colombia
0.6
/100
|
#256
Tragic
12.6%
Immigrants | Somalia
0.6
/100
|
#257
Tragic
12.6%
Indonesians
0.6
/100
|
#258
Tragic
12.6%