Pueblo vs Immigrants from Poland Average Family Size

COMPARE

Pueblo
Race
Ancestry
AfghanAfricanAlaska NativeAlaskan AthabascanAlbanianAleutAlsatianAmericanApacheArabArapahoArgentineanArmenianAssyrian/Chaldean/SyriacAustralianAustrianBahamianBangladeshiBarbadianBasqueBelgianBelizeanBermudanBhutaneseBlackfeetBolivianBrazilianBritishBritish West IndianBulgarianBurmeseCajunCambodianCanadianCape VerdeanCarpatho RusynCelticCentral AmericanCentral American IndianCherokeeCheyenneChickasawChileanChineseChippewaChoctawColombianColvilleComancheCosta RicanCreeCreekCroatianCrowCubanCypriotCzechCzechoslovakianDanishDelawareDominicanDutchDutch West IndianEastern EuropeanEcuadorianEgyptianEnglishEstonianEthiopianEuropeanFijianFilipinoFinnishFrenchFrench American IndianFrench CanadianGermanGerman RussianGhanaianGreekGuamanian/ChamorroGuatemalanGuyaneseHaitianHmongHonduranHopiHoumaHungarianIcelanderIndian (Asian)IndonesianInupiatIranianIraqiIrishIroquoisIsraeliItalianJamaicanJapaneseJordanianKenyanKiowaKoreanLaotianLatvianLebaneseLiberianLithuanianLumbeeLuxembourgerMacedonianMalaysianMalteseMarshalleseMenomineeMexicanMexican American IndianMongolianMoroccanNative HawaiianNavajoNepaleseNew ZealanderNicaraguanNigerianNorthern EuropeanNorwegianOkinawanOsageOttawaPaiutePakistaniPalestinianPanamanianParaguayanPennsylvania GermanPeruvianPimaPolishPortuguesePotawatomiPuebloPuerto RicanPuget Sound SalishRomanianRussianSalvadoranSamoanScandinavianScotch-IrishScottishSeminoleSenegaleseSerbianShoshoneSierra LeoneanSiouxSlavicSlovakSloveneSomaliSouth AfricanSouth AmericanSouth American IndianSoviet UnionSpaniardSpanishSpanish AmericanSpanish American IndianSri LankanSubsaharan AfricanSudaneseSwedishSwissSyrianTaiwaneseThaiTlingit-HaidaTohono O'OdhamTonganTrinidadian and TobagonianTsimshianTurkishU.S. Virgin IslanderUgandanUkrainianUruguayanUteVenezuelanVietnameseWelshWest IndianYakamaYaquiYugoslavianYumanYup'ikZimbabwean
Immigration
NonimmigrantsImmigrantsAfghanistanAfricaAlbaniaArgentinaArmeniaAsiaAustraliaAustriaBahamasBangladeshBarbadosBelarusBelgiumBelizeBoliviaBosnia and HerzegovinaBrazilBulgariaBurma/MyanmarCabo VerdeCambodiaCameroonCanadaCaribbeanCentral AmericaChileChinaColombiaCongoCosta RicaCroatiaCubaCzechoslovakiaDenmarkDominicaDominican RepublicEastern AfricaEastern AsiaEastern EuropeEcuadorEgyptEl SalvadorEnglandEritreaEthiopiaEuropeFijiFranceGermanyGhanaGreeceGrenadaGuatemalaGuyanaHaitiHondurasHong KongHungaryIndiaIndonesiaIranIraqIrelandIsraelItalyJamaicaJapanJordanKazakhstanKenyaKoreaKuwaitLaosLatin AmericaLatviaLebanonLiberiaLithuaniaMalaysiaMexicoMicronesiaMiddle AfricaMoldovaMoroccoNepalNetherlandsNicaraguaNigeriaNorth AmericaNorth MacedoniaNorthern AfricaNorthern EuropeNorwayOceaniaPakistanPanamaPeruPhilippinesPortugalRomaniaRussiaSaudi ArabiaScotlandSenegalSerbiaSierra LeoneSingaporeSomaliaSouth AfricaSouth AmericaSouth Central AsiaSouth Eastern AsiaSouthern EuropeSpainSri LankaSt. Vincent and the GrenadinesSudanSwedenSwitzerlandSyriaTaiwanThailandTrinidad and TobagoTurkeyUgandaUkraineUruguayUzbekistanVenezuelaVietnamWest IndiesWestern AfricaWestern AsiaWestern EuropeYemenZaireZimbabweAzores
Immigrants from Poland
Race
Ancestry
AfghanAfricanAlaska NativeAlaskan AthabascanAlbanianAleutAlsatianAmericanApacheArabArapahoArgentineanArmenianAssyrian/Chaldean/SyriacAustralianAustrianBahamianBangladeshiBarbadianBasqueBelgianBelizeanBermudanBhutaneseBlackfeetBolivianBrazilianBritishBritish West IndianBulgarianBurmeseCajunCambodianCanadianCape VerdeanCarpatho RusynCelticCentral AmericanCentral American IndianCherokeeCheyenneChickasawChileanChineseChippewaChoctawColombianColvilleComancheCosta RicanCreeCreekCroatianCrowCubanCypriotCzechCzechoslovakianDanishDelawareDominicanDutchDutch West IndianEastern EuropeanEcuadorianEgyptianEnglishEstonianEthiopianEuropeanFijianFilipinoFinnishFrenchFrench American IndianFrench CanadianGermanGerman RussianGhanaianGreekGuamanian/ChamorroGuatemalanGuyaneseHaitianHmongHonduranHopiHoumaHungarianIcelanderIndian (Asian)IndonesianInupiatIranianIraqiIrishIroquoisIsraeliItalianJamaicanJapaneseJordanianKenyanKiowaKoreanLaotianLatvianLebaneseLiberianLithuanianLumbeeLuxembourgerMacedonianMalaysianMalteseMarshalleseMenomineeMexicanMexican American IndianMongolianMoroccanNative HawaiianNavajoNepaleseNew ZealanderNicaraguanNigerianNorthern EuropeanNorwegianOkinawanOsageOttawaPaiutePakistaniPalestinianPanamanianParaguayanPennsylvania GermanPeruvianPimaPolishPortuguesePotawatomiPuerto RicanPuget Sound SalishRomanianRussianSalvadoranSamoanScandinavianScotch-IrishScottishSeminoleSenegaleseSerbianShoshoneSierra LeoneanSiouxSlavicSlovakSloveneSomaliSouth AfricanSouth AmericanSouth American IndianSoviet UnionSpaniardSpanishSpanish AmericanSpanish American IndianSri LankanSubsaharan AfricanSudaneseSwedishSwissSyrianTaiwaneseThaiTlingit-HaidaTohono O'OdhamTonganTrinidadian and TobagonianTsimshianTurkishU.S. Virgin IslanderUgandanUkrainianUruguayanUteVenezuelanVietnameseWelshWest IndianYakamaYaquiYugoslavianYumanYup'ikZimbabwean
Immigration
NonimmigrantsImmigrantsAfghanistanAfricaAlbaniaArgentinaArmeniaAsiaAustraliaAustriaBahamasBangladeshBarbadosBelarusBelgiumBelizeBoliviaBosnia and HerzegovinaBrazilBulgariaBurma/MyanmarCabo VerdeCambodiaCameroonCanadaCaribbeanCentral AmericaChileChinaColombiaCongoCosta RicaCroatiaCubaCzechoslovakiaDenmarkDominicaDominican RepublicEastern AfricaEastern AsiaEastern EuropeEcuadorEgyptEl SalvadorEnglandEritreaEthiopiaEuropeFijiFranceGermanyGhanaGreeceGrenadaGuatemalaGuyanaHaitiHondurasHong KongHungaryIndiaIndonesiaIranIraqIrelandIsraelItalyJamaicaJapanJordanKazakhstanKenyaKoreaKuwaitLaosLatin AmericaLatviaLebanonLiberiaLithuaniaMalaysiaMexicoMicronesiaMiddle AfricaMoldovaMoroccoNepalNetherlandsNicaraguaNigeriaNorth AmericaNorth MacedoniaNorthern AfricaNorthern EuropeNorwayOceaniaPakistanPanamaPeruPhilippinesPolandPortugalRomaniaRussiaSaudi ArabiaScotlandSenegalSerbiaSierra LeoneSingaporeSomaliaSouth AfricaSouth AmericaSouth Central AsiaSouth Eastern AsiaSouthern EuropeSpainSri LankaSt. Vincent and the GrenadinesSudanSwedenSwitzerlandSyriaTaiwanThailandTrinidad and TobagoTurkeyUgandaUkraineUruguayUzbekistanVenezuelaVietnamWest IndiesWestern AfricaWestern AsiaWestern EuropeYemenZaireZimbabweAzores
Average Family Size
Income
Poverty
Unemployment
Labor Participation
Family Structure
Vehicle Availability
Education Level
Disability

Average Family Size Comparison

Pueblo

Immigrants from Poland

Exceptional
Poor
3.79
AVERAGE FAMILY SIZE
100/ 100
METRIC RATING
3rd/ 347
METRIC RANK
3.20
AVERAGE FAMILY SIZE
16.6/ 100
METRIC RATING
204th/ 347
METRIC RANK

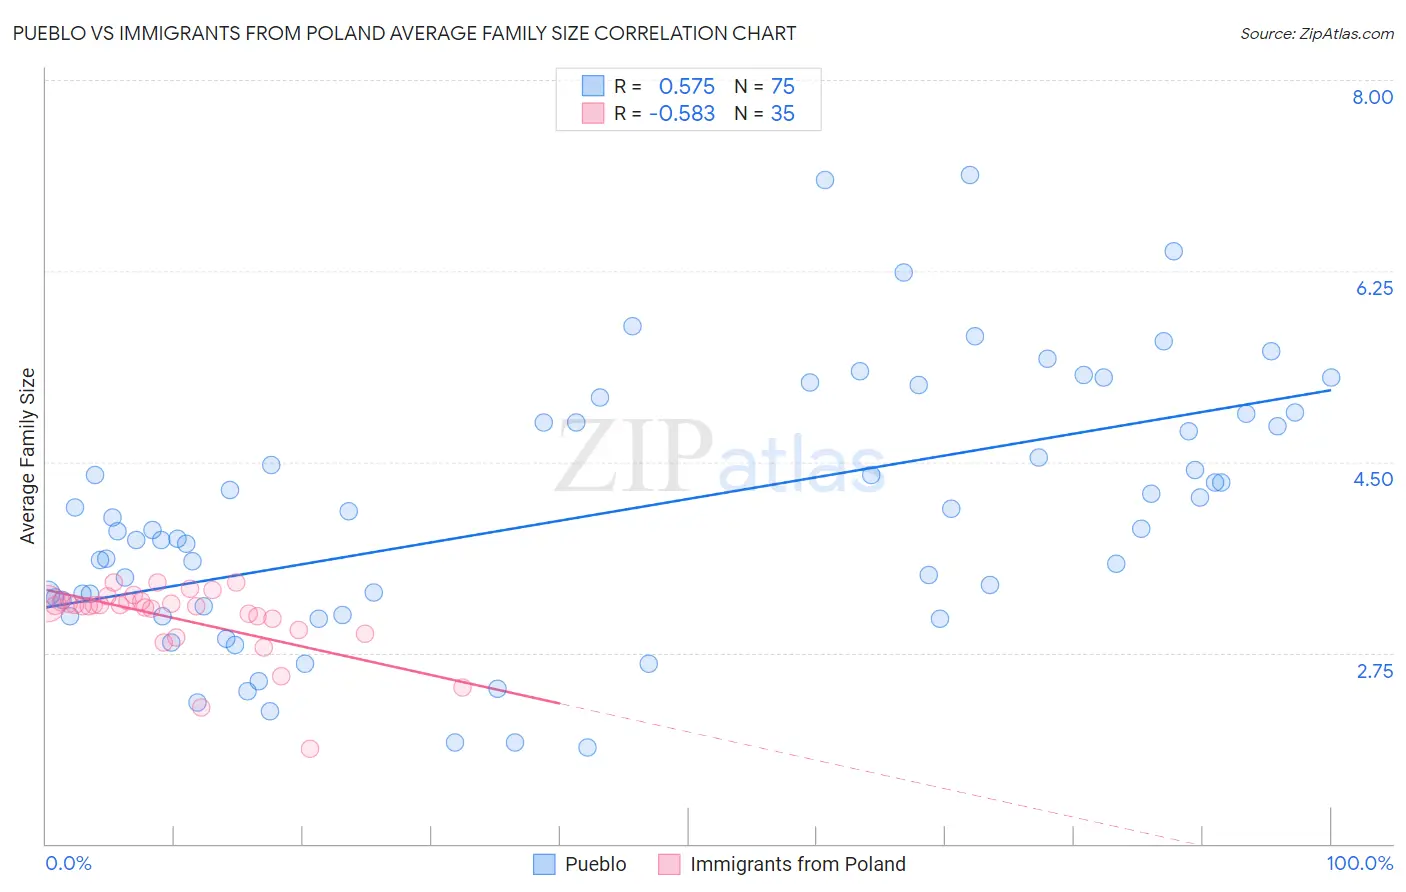
Pueblo vs Immigrants from Poland Average Family Size Correlation Chart

The statistical analysis conducted on geographies consisting of 120,067,636 people shows a substantial positive correlation between the proportion of Pueblo and average family size in the United States with a correlation coefficient (R) of 0.575 and weighted average of 3.79. Similarly, the statistical analysis conducted on geographies consisting of 304,786,853 people shows a substantial negative correlation between the proportion of Immigrants from Poland and average family size in the United States with a correlation coefficient (R) of -0.583 and weighted average of 3.20, a difference of 18.4%.
Pueblo vs Immigrants from Poland Average Family Size

Average Family Size Correlation Summary

MeasurementPuebloImmigrants from Poland
Minimum1.881.87
Maximum7.133.39
Range5.251.52
Mean4.023.06
Median3.883.18
Interquartile 25% (IQ1)3.172.96
Interquartile 75% (IQ3)4.863.22
Interquartile Range (IQR)1.690.26
Standard Deviation (Sample)1.180.33
Standard Deviation (Population)1.180.33

Similar Demographics by Average Family Size

Demographics Similar to Pueblo by Average Family Size

In terms of average family size, the demographic groups most similar to Pueblo are Crow (3.82, a difference of 0.81%), Pima (3.75, a difference of 1.3%), Navajo (3.65, a difference of 4.1%), Arapaho (3.64, a difference of 4.4%), and Inupiat (3.63, a difference of 4.6%).
DemographicsRating | RankAverage Family Size
Yup'ik
100
/100
|
#1
Exceptional
4.00
Crow
100
/100
|
#2
Exceptional
3.82
Pueblo
100
/100
|
#3
Exceptional
3.79
Pima
100
/100
|
#4
Exceptional
3.75
Navajo
100.0
/100
|
#5
Exceptional
3.65
Arapaho
100.0
/100
|
#6
Exceptional
3.64
Inupiat
100.0
/100
|
#7
Exceptional
3.63
Immigrants | Yemen
100.0
/100
|
#8
Exceptional
3.60
Hopi
100.0
/100
|
#9
Exceptional
3.60
Spanish American Indians
100.0
/100
|
#10
Exceptional
3.58
Tohono O'odham
100.0
/100
|
#11
Exceptional
3.53
Immigrants | Mexico
100.0
/100
|
#12
Exceptional
3.52
Sioux
100.0
/100
|
#13
Exceptional
3.52
Immigrants | Central America
100.0
/100
|
#14
Exceptional
3.49
Tongans
100.0
/100
|
#15
Exceptional
3.49

Demographics Similar to Immigrants from Poland by Average Family Size

In terms of average family size, the demographic groups most similar to Immigrants from Poland are Paraguayan (3.20, a difference of 0.010%), Immigrants from Cabo Verde (3.20, a difference of 0.020%), Immigrants from Nepal (3.21, a difference of 0.050%), Immigrants from Morocco (3.21, a difference of 0.060%), and Immigrants from India (3.21, a difference of 0.060%).
DemographicsRating | RankAverage Family Size
Kenyans
28.0
/100
|
#197
Fair
3.21
Immigrants | Azores
21.7
/100
|
#198
Fair
3.21
Hmong
20.7
/100
|
#199
Fair
3.21
Immigrants | Kenya
19.2
/100
|
#200
Poor
3.21
Immigrants | Morocco
18.5
/100
|
#201
Poor
3.21
Immigrants | India
18.5
/100
|
#202
Poor
3.21
Immigrants | Nepal
18.1
/100
|
#203
Poor
3.21
Immigrants | Poland
16.6
/100
|
#204
Poor
3.20
Paraguayans
16.3
/100
|
#205
Poor
3.20
Immigrants | Cabo Verde
16.0
/100
|
#206
Poor
3.20
Filipinos
13.6
/100
|
#207
Poor
3.20
Chippewa
13.3
/100
|
#208
Poor
3.20
Sudanese
13.3
/100
|
#209
Poor
3.20
Zimbabweans
12.6
/100
|
#210
Poor
3.20
Immigrants | Iran
12.1
/100
|
#211
Poor
3.20