Potawatomi vs Venezuelan Single Father Households
COMPARE
Potawatomi
Venezuelan
Single Father Households
Single Father Households Comparison
Potawatomi
Venezuelans
2.5%
SINGLE FATHER HOUSEHOLDS
1.4/ 100
METRIC RATING
256th/ 347
METRIC RANK
2.3%
SINGLE FATHER HOUSEHOLDS
86.2/ 100
METRIC RATING
150th/ 347
METRIC RANK
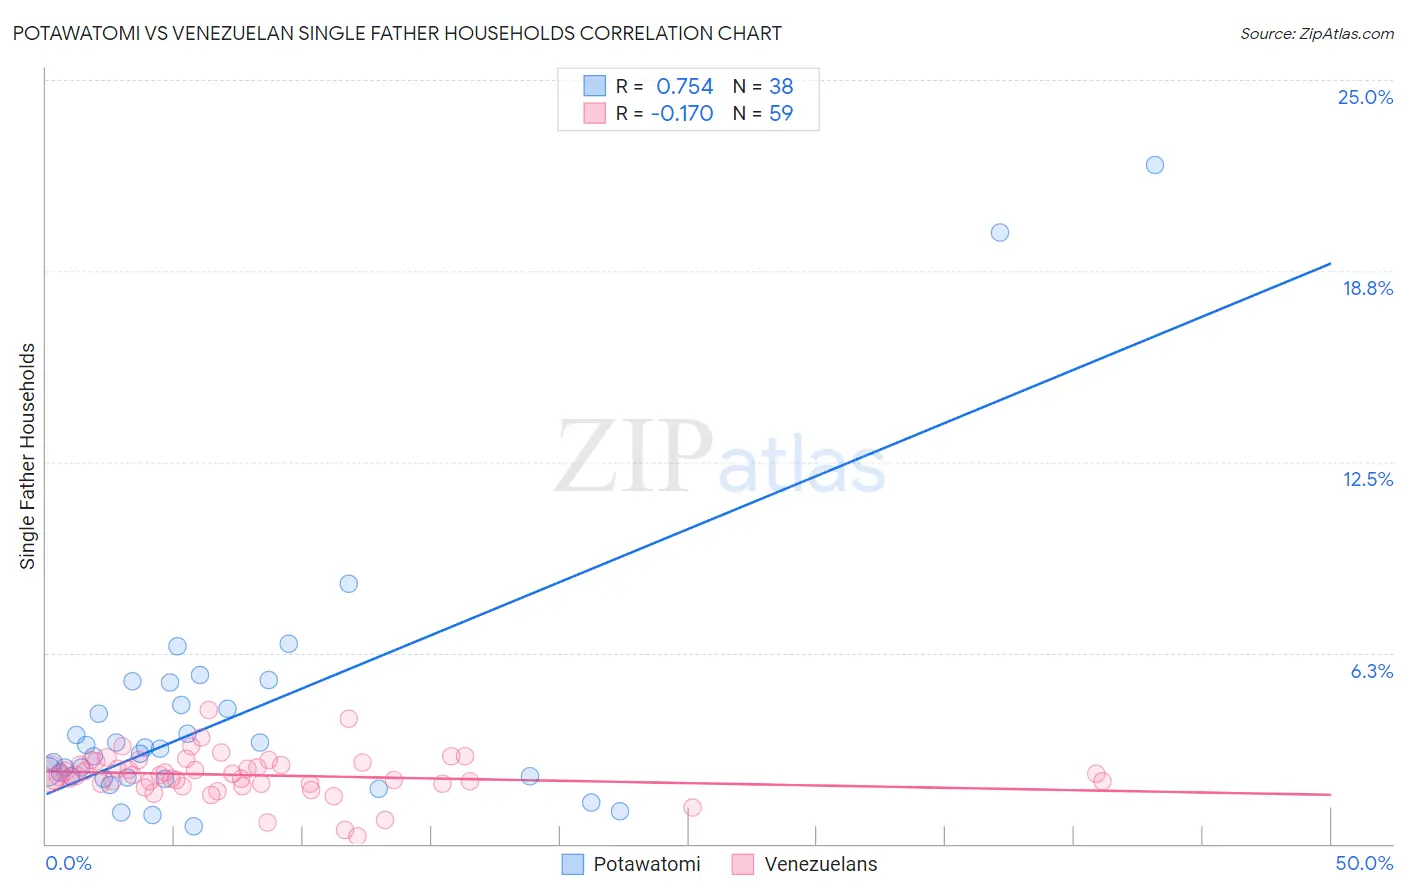
Potawatomi vs Venezuelan Single Father Households Correlation Chart
The statistical analysis conducted on geographies consisting of 117,445,996 people shows a strong positive correlation between the proportion of Potawatomi and percentage of single father households in the United States with a correlation coefficient (R) of 0.754 and weighted average of 2.5%. Similarly, the statistical analysis conducted on geographies consisting of 304,547,521 people shows a poor negative correlation between the proportion of Venezuelans and percentage of single father households in the United States with a correlation coefficient (R) of -0.170 and weighted average of 2.3%, a difference of 11.6%.
Single Father Households Correlation Summary
| Measurement | Potawatomi | Venezuelan |
| Minimum | 0.58% | 0.23% |
| Maximum | 22.2% | 4.4% |
| Range | 21.6% | 4.1% |
| Mean | 4.2% | 2.2% |
| Median | 3.0% | 2.2% |
| Interquartile 25% (IQ1) | 2.2% | 1.9% |
| Interquartile 75% (IQ3) | 4.5% | 2.7% |
| Interquartile Range (IQR) | 2.4% | 0.71% |
| Standard Deviation (Sample) | 4.4% | 0.73% |
| Standard Deviation (Population) | 4.3% | 0.72% |
Similar Demographics by Single Father Households
Demographics Similar to Potawatomi by Single Father Households
In terms of single father households, the demographic groups most similar to Potawatomi are Tongan (2.5%, a difference of 0.060%), Immigrants from Congo (2.5%, a difference of 0.29%), Spanish (2.5%, a difference of 0.37%), Immigrants from Thailand (2.5%, a difference of 0.47%), and Immigrants from Somalia (2.5%, a difference of 0.51%).
| Demographics | Rating | Rank | Single Father Households |
| Immigrants | Cameroon | 2.3 /100 | #249 | Tragic 2.5% |
| Somalis | 2.1 /100 | #250 | Tragic 2.5% |
| Liberians | 2.0 /100 | #251 | Tragic 2.5% |
| Immigrants | Eritrea | 2.0 /100 | #252 | Tragic 2.5% |
| Immigrants | Somalia | 1.9 /100 | #253 | Tragic 2.5% |
| Immigrants | Thailand | 1.8 /100 | #254 | Tragic 2.5% |
| Tongans | 1.5 /100 | #255 | Tragic 2.5% |
| Potawatomi | 1.4 /100 | #256 | Tragic 2.5% |
| Immigrants | Congo | 1.2 /100 | #257 | Tragic 2.5% |
| Spanish | 1.1 /100 | #258 | Tragic 2.5% |
| Comanche | 1.0 /100 | #259 | Tragic 2.5% |
| Immigrants | Caribbean | 1.0 /100 | #260 | Tragic 2.5% |
| Immigrants | Belize | 0.9 /100 | #261 | Tragic 2.5% |
| Immigrants | Liberia | 0.8 /100 | #262 | Tragic 2.5% |
| Dominicans | 0.8 /100 | #263 | Tragic 2.5% |
Demographics Similar to Venezuelans by Single Father Households
In terms of single father households, the demographic groups most similar to Venezuelans are Immigrants from Syria (2.3%, a difference of 0.21%), Senegalese (2.3%, a difference of 0.38%), South American Indian (2.3%, a difference of 0.39%), Immigrants from Venezuela (2.3%, a difference of 0.44%), and Slavic (2.2%, a difference of 0.49%).
| Demographics | Rating | Rank | Single Father Households |
| Immigrants | Nepal | 92.1 /100 | #143 | Exceptional 2.2% |
| Slovaks | 90.7 /100 | #144 | Exceptional 2.2% |
| Immigrants | Zimbabwe | 90.2 /100 | #145 | Exceptional 2.2% |
| Northern Europeans | 89.8 /100 | #146 | Excellent 2.2% |
| Slavs | 88.9 /100 | #147 | Excellent 2.2% |
| South American Indians | 88.5 /100 | #148 | Excellent 2.3% |
| Senegalese | 88.4 /100 | #149 | Excellent 2.3% |
| Venezuelans | 86.2 /100 | #150 | Excellent 2.3% |
| Immigrants | Syria | 84.8 /100 | #151 | Excellent 2.3% |
| Immigrants | Venezuela | 83.2 /100 | #152 | Excellent 2.3% |
| Immigrants | Germany | 82.8 /100 | #153 | Excellent 2.3% |
| Bolivians | 81.0 /100 | #154 | Excellent 2.3% |
| Europeans | 80.9 /100 | #155 | Excellent 2.3% |
| Immigrants | South America | 79.9 /100 | #156 | Good 2.3% |
| Canadians | 79.7 /100 | #157 | Good 2.3% |