Potawatomi vs Immigrants from Bulgaria Births to Unmarried Women
COMPARE
Potawatomi
Immigrants from Bulgaria
Births to Unmarried Women
Births to Unmarried Women Comparison
Potawatomi
Immigrants from Bulgaria
36.2%
BIRTHS TO UNMARRIED WOMEN
0.2/ 100
METRIC RATING
254th/ 347
METRIC RANK
27.6%
BIRTHS TO UNMARRIED WOMEN
99.6/ 100
METRIC RATING
43rd/ 347
METRIC RANK
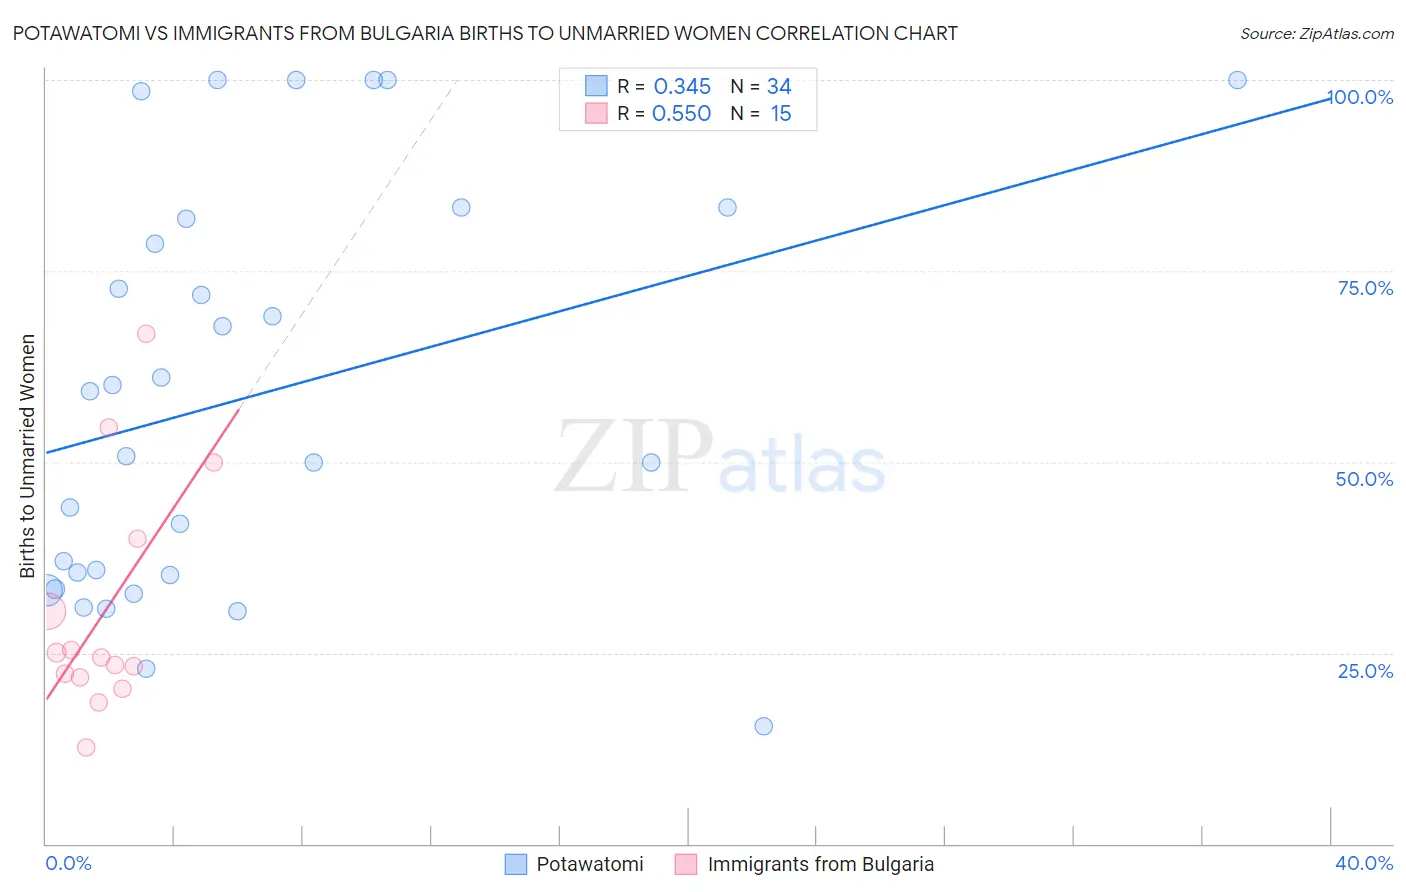
Potawatomi vs Immigrants from Bulgaria Births to Unmarried Women Correlation Chart
The statistical analysis conducted on geographies consisting of 115,144,895 people shows a mild positive correlation between the proportion of Potawatomi and percentage of births to unmarried women in the United States with a correlation coefficient (R) of 0.345 and weighted average of 36.2%. Similarly, the statistical analysis conducted on geographies consisting of 164,531,570 people shows a substantial positive correlation between the proportion of Immigrants from Bulgaria and percentage of births to unmarried women in the United States with a correlation coefficient (R) of 0.550 and weighted average of 27.6%, a difference of 31.2%.
Births to Unmarried Women Correlation Summary
| Measurement | Potawatomi | Immigrants from Bulgaria |
| Minimum | 15.4% | 12.6% |
| Maximum | 100.0% | 66.7% |
| Range | 84.6% | 54.1% |
| Mean | 58.7% | 30.6% |
| Median | 55.0% | 24.4% |
| Interquartile 25% (IQ1) | 35.2% | 21.8% |
| Interquartile 75% (IQ3) | 81.8% | 40.0% |
| Interquartile Range (IQR) | 46.6% | 18.2% |
| Standard Deviation (Sample) | 26.4% | 15.3% |
| Standard Deviation (Population) | 26.1% | 14.8% |
Similar Demographics by Births to Unmarried Women
Demographics Similar to Potawatomi by Births to Unmarried Women
In terms of births to unmarried women, the demographic groups most similar to Potawatomi are Chickasaw (36.3%, a difference of 0.14%), Immigrants from Trinidad and Tobago (36.3%, a difference of 0.14%), Immigrants from Grenada (36.3%, a difference of 0.16%), Immigrants from Portugal (36.2%, a difference of 0.22%), and American (36.4%, a difference of 0.45%).
| Demographics | Rating | Rank | Births to Unmarried Women |
| Immigrants | Nigeria | 0.7 /100 | #247 | Tragic 35.4% |
| Immigrants | Nonimmigrants | 0.6 /100 | #248 | Tragic 35.5% |
| Bermudans | 0.6 /100 | #249 | Tragic 35.5% |
| Mexican American Indians | 0.4 /100 | #250 | Tragic 35.7% |
| Immigrants | Western Africa | 0.3 /100 | #251 | Tragic 36.0% |
| Salvadorans | 0.3 /100 | #252 | Tragic 36.0% |
| Immigrants | Portugal | 0.2 /100 | #253 | Tragic 36.2% |
| Potawatomi | 0.2 /100 | #254 | Tragic 36.2% |
| Chickasaw | 0.2 /100 | #255 | Tragic 36.3% |
| Immigrants | Trinidad and Tobago | 0.2 /100 | #256 | Tragic 36.3% |
| Immigrants | Grenada | 0.2 /100 | #257 | Tragic 36.3% |
| Americans | 0.2 /100 | #258 | Tragic 36.4% |
| Immigrants | El Salvador | 0.2 /100 | #259 | Tragic 36.4% |
| Ottawa | 0.2 /100 | #260 | Tragic 36.5% |
| Trinidadians and Tobagonians | 0.2 /100 | #261 | Tragic 36.5% |
Demographics Similar to Immigrants from Bulgaria by Births to Unmarried Women
In terms of births to unmarried women, the demographic groups most similar to Immigrants from Bulgaria are Immigrants from Eastern Europe (27.6%, a difference of 0.23%), Iraqi (27.6%, a difference of 0.24%), Immigrants from Indonesia (27.7%, a difference of 0.26%), Latvian (27.7%, a difference of 0.36%), and Immigrants from Lithuania (27.7%, a difference of 0.40%).
| Demographics | Rating | Rank | Births to Unmarried Women |
| Immigrants | Western Asia | 99.7 /100 | #36 | Exceptional 27.2% |
| Immigrants | Ukraine | 99.7 /100 | #37 | Exceptional 27.2% |
| Immigrants | Moldova | 99.7 /100 | #38 | Exceptional 27.3% |
| Immigrants | Malaysia | 99.7 /100 | #39 | Exceptional 27.4% |
| Turks | 99.6 /100 | #40 | Exceptional 27.4% |
| Iraqis | 99.6 /100 | #41 | Exceptional 27.6% |
| Immigrants | Eastern Europe | 99.6 /100 | #42 | Exceptional 27.6% |
| Immigrants | Bulgaria | 99.6 /100 | #43 | Exceptional 27.6% |
| Immigrants | Indonesia | 99.5 /100 | #44 | Exceptional 27.7% |
| Latvians | 99.5 /100 | #45 | Exceptional 27.7% |
| Immigrants | Lithuania | 99.5 /100 | #46 | Exceptional 27.7% |
| Hmong | 99.5 /100 | #47 | Exceptional 27.7% |
| Eastern Europeans | 99.5 /100 | #48 | Exceptional 27.7% |
| Immigrants | Greece | 99.4 /100 | #49 | Exceptional 27.8% |
| Maltese | 99.4 /100 | #50 | Exceptional 27.8% |