Pima vs Immigrants from Italy Family Households with Children
COMPARE
Pima
Immigrants from Italy
Family Households with Children
Family Households with Children Comparison
Pima
Immigrants from Italy
27.1%
FAMILY HOUSEHOLDS WITH CHILDREN
9.2/ 100
METRIC RATING
223rd/ 347
METRIC RANK
27.0%
FAMILY HOUSEHOLDS WITH CHILDREN
5.0/ 100
METRIC RATING
233rd/ 347
METRIC RANK
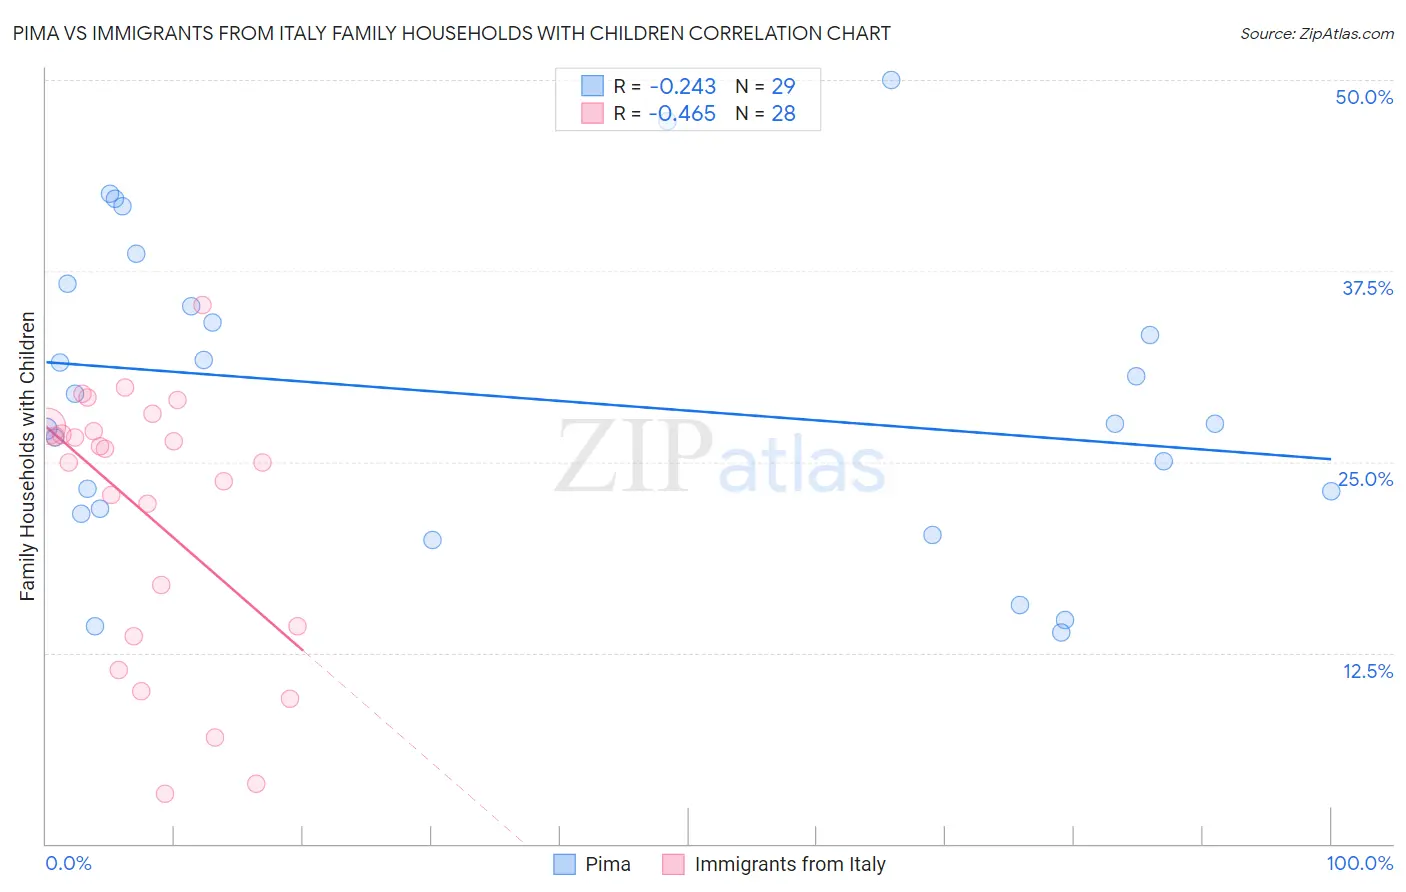
Pima vs Immigrants from Italy Family Households with Children Correlation Chart
The statistical analysis conducted on geographies consisting of 61,534,200 people shows a weak negative correlation between the proportion of Pima and percentage of family households with children in the United States with a correlation coefficient (R) of -0.243 and weighted average of 27.1%. Similarly, the statistical analysis conducted on geographies consisting of 323,996,481 people shows a moderate negative correlation between the proportion of Immigrants from Italy and percentage of family households with children in the United States with a correlation coefficient (R) of -0.465 and weighted average of 27.0%, a difference of 0.36%.
Family Households with Children Correlation Summary
| Measurement | Pima | Immigrants from Italy |
| Minimum | 13.8% | 3.3% |
| Maximum | 50.0% | 35.3% |
| Range | 36.2% | 32.0% |
| Mean | 29.2% | 21.5% |
| Median | 27.5% | 25.4% |
| Interquartile 25% (IQ1) | 21.8% | 13.9% |
| Interquartile 75% (IQ3) | 35.9% | 27.2% |
| Interquartile Range (IQR) | 14.2% | 13.2% |
| Standard Deviation (Sample) | 9.9% | 8.8% |
| Standard Deviation (Population) | 9.7% | 8.6% |
Demographics Similar to Pima and Immigrants from Italy by Family Households with Children
In terms of family households with children, the demographic groups most similar to Pima are Paraguayan (27.1%, a difference of 0.010%), New Zealander (27.1%, a difference of 0.030%), German (27.1%, a difference of 0.030%), Austrian (27.1%, a difference of 0.050%), and Immigrants from Japan (27.1%, a difference of 0.090%). Similarly, the demographic groups most similar to Immigrants from Italy are Yugoslavian (27.0%, a difference of 0.0%), Luxembourger (27.0%, a difference of 0.050%), Bulgarian (27.0%, a difference of 0.080%), Immigrants from Germany (27.0%, a difference of 0.080%), and Immigrants from Morocco (27.0%, a difference of 0.11%).
| Demographics | Rating | Rank | Family Households with Children |
| Greeks | 11.4 /100 | #218 | Poor 27.1% |
| Immigrants | Japan | 10.7 /100 | #219 | Poor 27.1% |
| Austrians | 9.9 /100 | #220 | Tragic 27.1% |
| New Zealanders | 9.6 /100 | #221 | Tragic 27.1% |
| Paraguayans | 9.4 /100 | #222 | Tragic 27.1% |
| Pima | 9.2 /100 | #223 | Tragic 27.1% |
| Germans | 8.7 /100 | #224 | Tragic 27.1% |
| Canadians | 7.5 /100 | #225 | Tragic 27.1% |
| Czechoslovakians | 6.6 /100 | #226 | Tragic 27.0% |
| Tsimshian | 6.6 /100 | #227 | Tragic 27.0% |
| Scottish | 6.5 /100 | #228 | Tragic 27.0% |
| Immigrants | Caribbean | 6.3 /100 | #229 | Tragic 27.0% |
| Bulgarians | 5.8 /100 | #230 | Tragic 27.0% |
| Luxembourgers | 5.5 /100 | #231 | Tragic 27.0% |
| Yugoslavians | 5.1 /100 | #232 | Tragic 27.0% |
| Immigrants | Italy | 5.0 /100 | #233 | Tragic 27.0% |
| Immigrants | Germany | 4.4 /100 | #234 | Tragic 27.0% |
| Immigrants | Morocco | 4.2 /100 | #235 | Tragic 27.0% |
| Cape Verdeans | 3.6 /100 | #236 | Tragic 26.9% |
| Immigrants | Netherlands | 3.5 /100 | #237 | Tragic 26.9% |
| Moroccans | 3.4 /100 | #238 | Tragic 26.9% |