Pennsylvania German vs Immigrants from Sierra Leone Family Households
COMPARE
Pennsylvania German
Immigrants from Sierra Leone
Family Households
Family Households Comparison
Pennsylvania Germans
Immigrants from Sierra Leone
66.1%
FAMILY HOUSEHOLDS
100.0/ 100
METRIC RATING
57th/ 347
METRIC RANK
64.3%
FAMILY HOUSEHOLDS
52.5/ 100
METRIC RATING
173rd/ 347
METRIC RANK
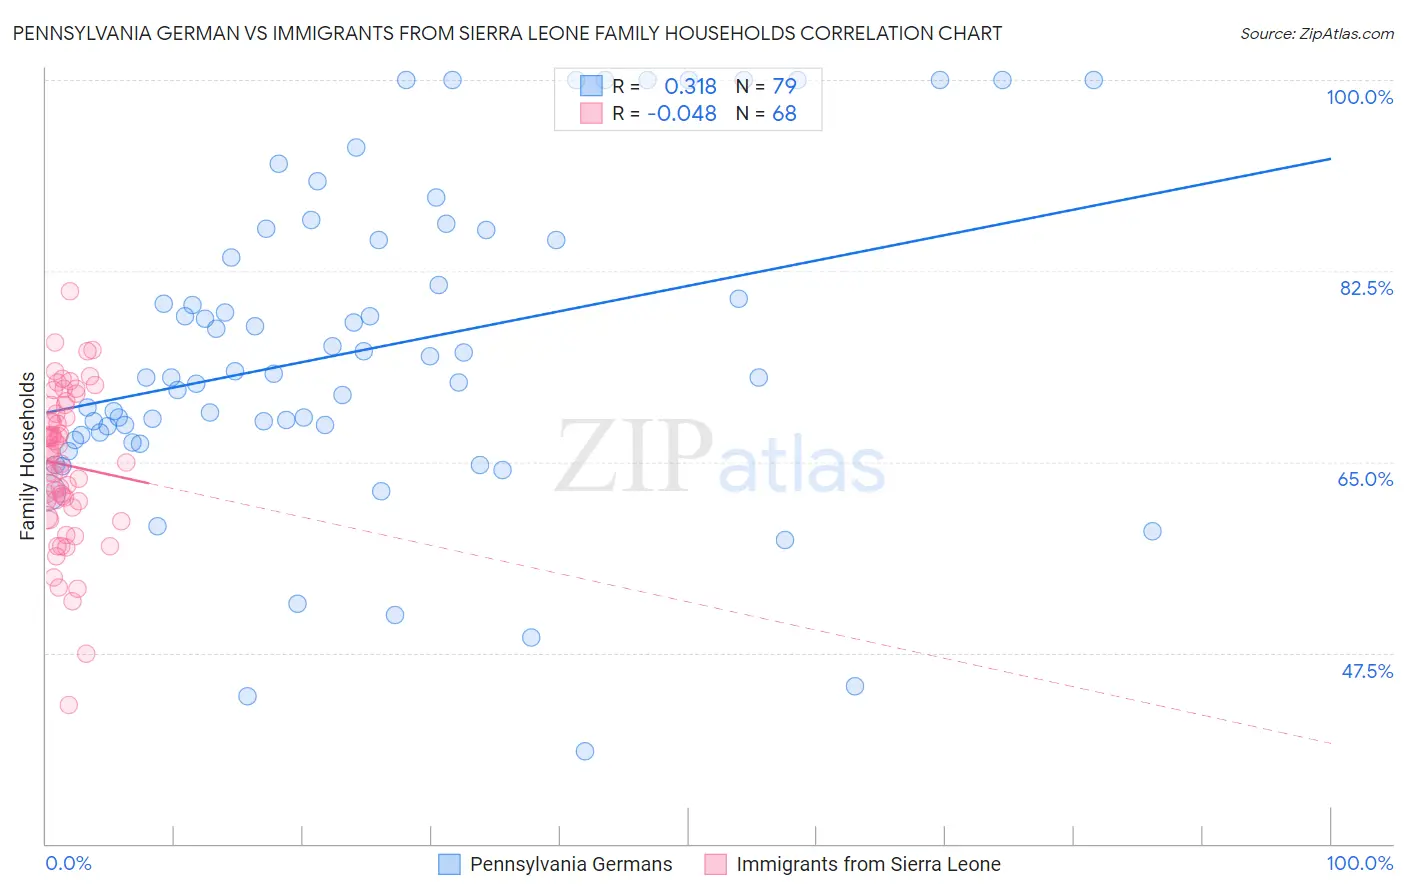
Pennsylvania German vs Immigrants from Sierra Leone Family Households Correlation Chart
The statistical analysis conducted on geographies consisting of 234,061,495 people shows a mild positive correlation between the proportion of Pennsylvania Germans and percentage of family households in the United States with a correlation coefficient (R) of 0.318 and weighted average of 66.1%. Similarly, the statistical analysis conducted on geographies consisting of 101,647,201 people shows no correlation between the proportion of Immigrants from Sierra Leone and percentage of family households in the United States with a correlation coefficient (R) of -0.048 and weighted average of 64.3%, a difference of 2.8%.
Family Households Correlation Summary
| Measurement | Pennsylvania German | Immigrants from Sierra Leone |
| Minimum | 38.5% | 42.7% |
| Maximum | 100.0% | 80.6% |
| Range | 61.5% | 37.9% |
| Mean | 75.3% | 64.7% |
| Median | 72.8% | 65.3% |
| Interquartile 25% (IQ1) | 67.5% | 61.1% |
| Interquartile 75% (IQ3) | 85.4% | 69.8% |
| Interquartile Range (IQR) | 17.9% | 8.7% |
| Standard Deviation (Sample) | 14.5% | 7.0% |
| Standard Deviation (Population) | 14.4% | 6.9% |
Similar Demographics by Family Households
Demographics Similar to Pennsylvania Germans by Family Households
In terms of family households, the demographic groups most similar to Pennsylvania Germans are Immigrants from Hong Kong (66.1%, a difference of 0.020%), Immigrants (66.1%, a difference of 0.030%), Immigrants from Asia (66.1%, a difference of 0.11%), Immigrants from Korea (66.0%, a difference of 0.12%), and South American (66.0%, a difference of 0.13%).
| Demographics | Rating | Rank | Family Households |
| Navajo | 100.0 /100 | #50 | Exceptional 66.4% |
| Natives/Alaskans | 100.0 /100 | #51 | Exceptional 66.4% |
| Colombians | 100.0 /100 | #52 | Exceptional 66.3% |
| Afghans | 100.0 /100 | #53 | Exceptional 66.3% |
| Immigrants | Colombia | 100.0 /100 | #54 | Exceptional 66.3% |
| Immigrants | Immigrants | 100.0 /100 | #55 | Exceptional 66.1% |
| Immigrants | Hong Kong | 100.0 /100 | #56 | Exceptional 66.1% |
| Pennsylvania Germans | 100.0 /100 | #57 | Exceptional 66.1% |
| Immigrants | Asia | 100.0 /100 | #58 | Exceptional 66.1% |
| Immigrants | Korea | 100.0 /100 | #59 | Exceptional 66.0% |
| South Americans | 100.0 /100 | #60 | Exceptional 66.0% |
| Danes | 100.0 /100 | #61 | Exceptional 66.0% |
| Central Americans | 100.0 /100 | #62 | Exceptional 66.0% |
| Immigrants | Indonesia | 100.0 /100 | #63 | Exceptional 66.0% |
| Pima | 99.9 /100 | #64 | Exceptional 65.9% |
Demographics Similar to Immigrants from Sierra Leone by Family Households
In terms of family households, the demographic groups most similar to Immigrants from Sierra Leone are Dutch West Indian (64.3%, a difference of 0.020%), Ute (64.3%, a difference of 0.030%), Immigrants from Germany (64.3%, a difference of 0.030%), Iraqi (64.4%, a difference of 0.050%), and Armenian (64.4%, a difference of 0.050%).
| Demographics | Rating | Rank | Family Households |
| Scotch-Irish | 59.2 /100 | #166 | Average 64.4% |
| Irish | 57.9 /100 | #167 | Average 64.4% |
| Hondurans | 57.5 /100 | #168 | Average 64.4% |
| Iraqis | 56.0 /100 | #169 | Average 64.4% |
| Armenians | 55.9 /100 | #170 | Average 64.4% |
| Ute | 54.6 /100 | #171 | Average 64.3% |
| Dutch West Indians | 53.9 /100 | #172 | Average 64.3% |
| Immigrants | Sierra Leone | 52.5 /100 | #173 | Average 64.3% |
| Immigrants | Germany | 50.0 /100 | #174 | Average 64.3% |
| Bangladeshis | 44.3 /100 | #175 | Average 64.3% |
| Vietnamese | 43.6 /100 | #176 | Average 64.2% |
| Immigrants | Micronesia | 42.3 /100 | #177 | Average 64.2% |
| Jamaicans | 40.6 /100 | #178 | Average 64.2% |
| Immigrants | Ukraine | 38.2 /100 | #179 | Fair 64.2% |
| Immigrants | Honduras | 35.0 /100 | #180 | Fair 64.2% |