Ottawa vs Indian (Asian) Average Family Size
COMPARE
Ottawa
Indian (Asian)
Average Family Size
Average Family Size Comparison
Ottawa
Indians (Asian)
3.11
AVERAGE FAMILY SIZE
0.0/ 100
METRIC RATING
326th/ 347
METRIC RANK
3.24
AVERAGE FAMILY SIZE
73.6/ 100
METRIC RATING
150th/ 347
METRIC RANK
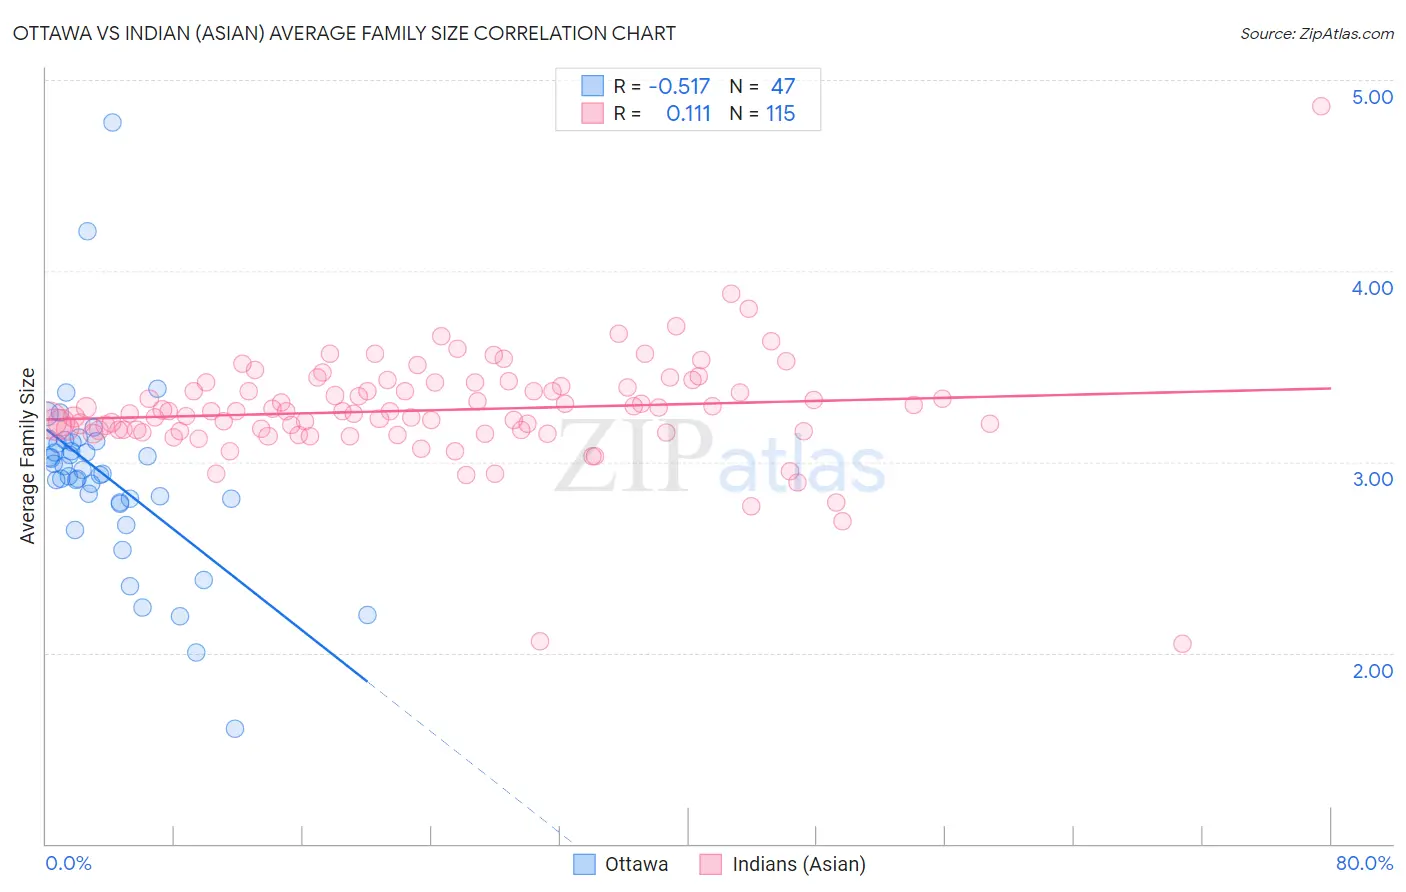
Ottawa vs Indian (Asian) Average Family Size Correlation Chart
The statistical analysis conducted on geographies consisting of 49,944,420 people shows a substantial negative correlation between the proportion of Ottawa and average family size in the United States with a correlation coefficient (R) of -0.517 and weighted average of 3.11. Similarly, the statistical analysis conducted on geographies consisting of 494,783,679 people shows a poor positive correlation between the proportion of Indians (Asian) and average family size in the United States with a correlation coefficient (R) of 0.111 and weighted average of 3.24, a difference of 4.3%.
Average Family Size Correlation Summary
| Measurement | Ottawa | Indian (Asian) |
| Minimum | 1.60 | 2.05 |
| Maximum | 4.78 | 4.86 |
| Range | 3.18 | 2.81 |
| Mean | 2.92 | 3.27 |
| Median | 2.94 | 3.26 |
| Interquartile 25% (IQ1) | 2.79 | 3.16 |
| Interquartile 75% (IQ3) | 3.10 | 3.40 |
| Interquartile Range (IQR) | 0.31 | 0.24 |
| Standard Deviation (Sample) | 0.49 | 0.30 |
| Standard Deviation (Population) | 0.49 | 0.29 |
Similar Demographics by Average Family Size
Demographics Similar to Ottawa by Average Family Size
In terms of average family size, the demographic groups most similar to Ottawa are Dutch (3.11, a difference of 0.010%), Czech (3.11, a difference of 0.010%), English (3.11, a difference of 0.050%), Belgian (3.11, a difference of 0.070%), and Celtic (3.11, a difference of 0.090%).
| Demographics | Rating | Rank | Average Family Size |
| Welsh | 0.1 /100 | #319 | Tragic 3.12 |
| Immigrants | North America | 0.0 /100 | #320 | Tragic 3.12 |
| Immigrants | Austria | 0.0 /100 | #321 | Tragic 3.12 |
| Immigrants | Canada | 0.0 /100 | #322 | Tragic 3.12 |
| Soviet Union | 0.0 /100 | #323 | Tragic 3.11 |
| Celtics | 0.0 /100 | #324 | Tragic 3.11 |
| English | 0.0 /100 | #325 | Tragic 3.11 |
| Ottawa | 0.0 /100 | #326 | Tragic 3.11 |
| Dutch | 0.0 /100 | #327 | Tragic 3.11 |
| Czechs | 0.0 /100 | #328 | Tragic 3.11 |
| Belgians | 0.0 /100 | #329 | Tragic 3.11 |
| Latvians | 0.0 /100 | #330 | Tragic 3.11 |
| Scotch-Irish | 0.0 /100 | #331 | Tragic 3.11 |
| Scottish | 0.0 /100 | #332 | Tragic 3.11 |
| Estonians | 0.0 /100 | #333 | Tragic 3.10 |
Demographics Similar to Indians (Asian) by Average Family Size
In terms of average family size, the demographic groups most similar to Indians (Asian) are Assyrian/Chaldean/Syriac (3.24, a difference of 0.0%), Jordanian (3.24, a difference of 0.0%), Blackfeet (3.24, a difference of 0.030%), Spanish American (3.24, a difference of 0.030%), and Immigrants from Jordan (3.24, a difference of 0.050%).
| Demographics | Rating | Rank | Average Family Size |
| Bhutanese | 81.0 /100 | #143 | Excellent 3.25 |
| Tsimshian | 80.2 /100 | #144 | Excellent 3.25 |
| Armenians | 78.2 /100 | #145 | Good 3.25 |
| Immigrants | Africa | 77.9 /100 | #146 | Good 3.25 |
| Immigrants | Jordan | 75.7 /100 | #147 | Good 3.24 |
| Blackfeet | 75.0 /100 | #148 | Good 3.24 |
| Assyrians/Chaldeans/Syriacs | 73.8 /100 | #149 | Good 3.24 |
| Indians (Asian) | 73.6 /100 | #150 | Good 3.24 |
| Jordanians | 73.5 /100 | #151 | Good 3.24 |
| Spanish Americans | 72.5 /100 | #152 | Good 3.24 |
| Immigrants | Eritrea | 71.4 /100 | #153 | Good 3.24 |
| Immigrants | Egypt | 70.0 /100 | #154 | Good 3.24 |
| Seminole | 68.2 /100 | #155 | Good 3.24 |
| Immigrants | Taiwan | 68.1 /100 | #156 | Good 3.24 |
| Immigrants | Uzbekistan | 67.0 /100 | #157 | Good 3.24 |