Okinawan vs Immigrants from Kazakhstan Single Mother Households
COMPARE
Okinawan
Immigrants from Kazakhstan
Single Mother Households
Single Mother Households Comparison
Okinawans
Immigrants from Kazakhstan
5.0%
SINGLE MOTHER HOUSEHOLDS
99.9/ 100
METRIC RATING
9th/ 347
METRIC RANK
5.6%
SINGLE MOTHER HOUSEHOLDS
98.4/ 100
METRIC RATING
71st/ 347
METRIC RANK
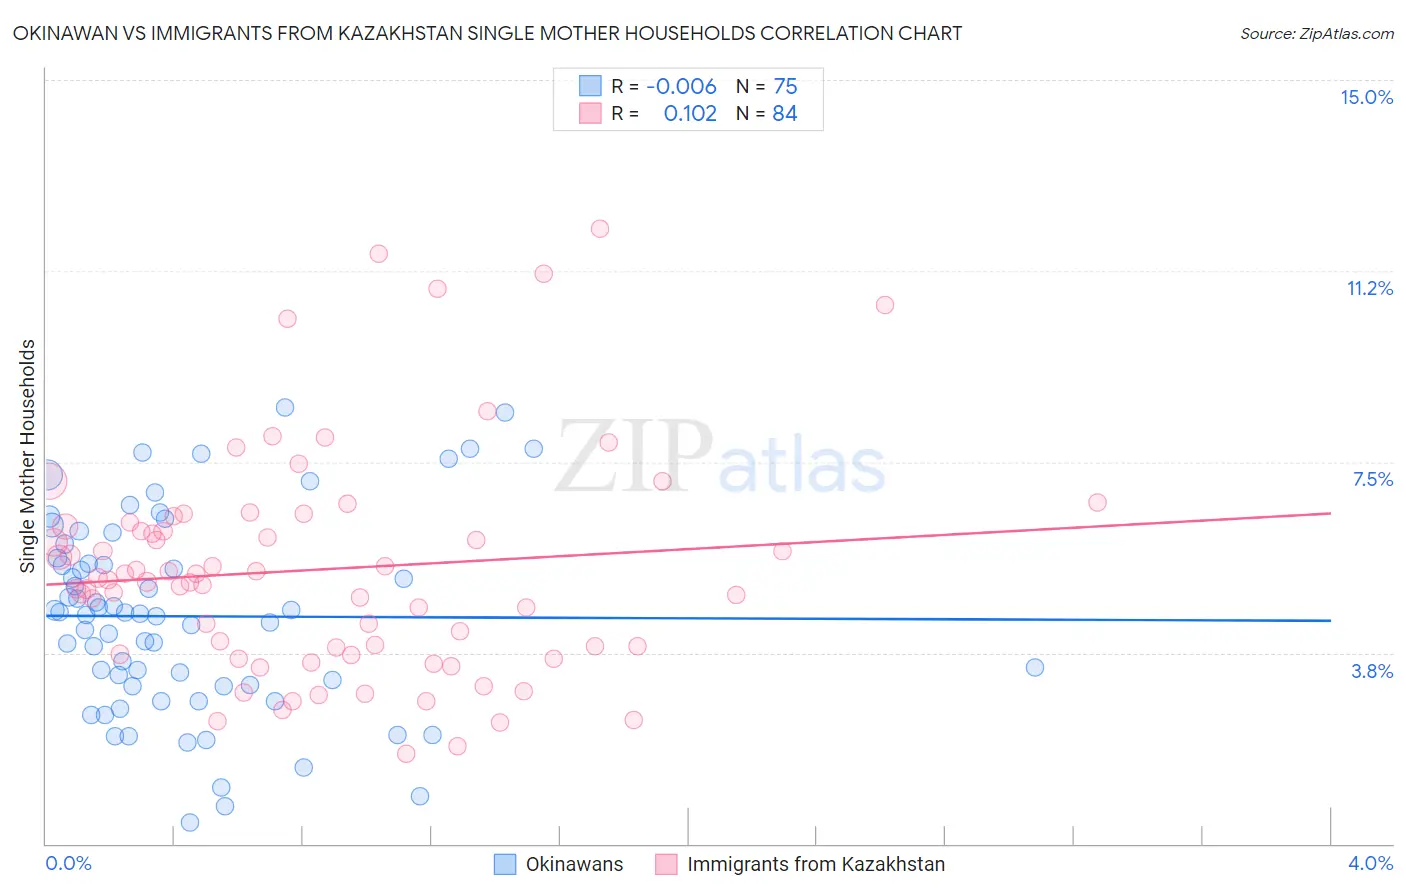
Okinawan vs Immigrants from Kazakhstan Single Mother Households Correlation Chart
The statistical analysis conducted on geographies consisting of 73,669,533 people shows no correlation between the proportion of Okinawans and percentage of single mother households in the United States with a correlation coefficient (R) of -0.006 and weighted average of 5.0%. Similarly, the statistical analysis conducted on geographies consisting of 124,312,520 people shows a poor positive correlation between the proportion of Immigrants from Kazakhstan and percentage of single mother households in the United States with a correlation coefficient (R) of 0.102 and weighted average of 5.6%, a difference of 11.7%.
Single Mother Households Correlation Summary
| Measurement | Okinawan | Immigrants from Kazakhstan |
| Minimum | 0.42% | 1.8% |
| Maximum | 8.6% | 12.1% |
| Range | 8.1% | 10.3% |
| Mean | 4.5% | 5.4% |
| Median | 4.5% | 5.2% |
| Interquartile 25% (IQ1) | 3.1% | 3.8% |
| Interquartile 75% (IQ3) | 5.6% | 6.3% |
| Interquartile Range (IQR) | 2.5% | 2.5% |
| Standard Deviation (Sample) | 1.9% | 2.2% |
| Standard Deviation (Population) | 1.9% | 2.2% |
Similar Demographics by Single Mother Households
Demographics Similar to Okinawans by Single Mother Households
In terms of single mother households, the demographic groups most similar to Okinawans are Immigrants from Ireland (5.0%, a difference of 0.15%), Immigrants from Israel (5.0%, a difference of 0.34%), Iranian (5.0%, a difference of 0.81%), Immigrants from China (5.1%, a difference of 0.97%), and Immigrants from Singapore (5.0%, a difference of 1.1%).
| Demographics | Rating | Rank | Single Mother Households |
| Filipinos | 100.0 /100 | #2 | Exceptional 4.7% |
| Immigrants | Iran | 100.0 /100 | #3 | Exceptional 4.8% |
| Assyrians/Chaldeans/Syriacs | 100.0 /100 | #4 | Exceptional 4.8% |
| Immigrants | Hong Kong | 100.0 /100 | #5 | Exceptional 4.8% |
| Immigrants | Singapore | 100.0 /100 | #6 | Exceptional 5.0% |
| Iranians | 100.0 /100 | #7 | Exceptional 5.0% |
| Immigrants | Ireland | 99.9 /100 | #8 | Exceptional 5.0% |
| Okinawans | 99.9 /100 | #9 | Exceptional 5.0% |
| Immigrants | Israel | 99.9 /100 | #10 | Exceptional 5.0% |
| Immigrants | China | 99.9 /100 | #11 | Exceptional 5.1% |
| Cypriots | 99.9 /100 | #12 | Exceptional 5.1% |
| Immigrants | India | 99.9 /100 | #13 | Exceptional 5.1% |
| Immigrants | Australia | 99.9 /100 | #14 | Exceptional 5.1% |
| Immigrants | Eastern Asia | 99.9 /100 | #15 | Exceptional 5.1% |
| Indians (Asian) | 99.9 /100 | #16 | Exceptional 5.1% |
Demographics Similar to Immigrants from Kazakhstan by Single Mother Households
In terms of single mother households, the demographic groups most similar to Immigrants from Kazakhstan are Immigrants from Eastern Europe (5.6%, a difference of 0.010%), Asian (5.6%, a difference of 0.080%), Immigrants from Netherlands (5.6%, a difference of 0.090%), Immigrants from Bulgaria (5.6%, a difference of 0.11%), and Immigrants from Asia (5.6%, a difference of 0.15%).
| Demographics | Rating | Rank | Single Mother Households |
| Immigrants | France | 98.6 /100 | #64 | Exceptional 5.6% |
| Greeks | 98.6 /100 | #65 | Exceptional 5.6% |
| Immigrants | Canada | 98.5 /100 | #66 | Exceptional 5.6% |
| Italians | 98.5 /100 | #67 | Exceptional 5.6% |
| Immigrants | Bulgaria | 98.5 /100 | #68 | Exceptional 5.6% |
| Asians | 98.5 /100 | #69 | Exceptional 5.6% |
| Immigrants | Eastern Europe | 98.4 /100 | #70 | Exceptional 5.6% |
| Immigrants | Kazakhstan | 98.4 /100 | #71 | Exceptional 5.6% |
| Immigrants | Netherlands | 98.4 /100 | #72 | Exceptional 5.6% |
| Immigrants | Asia | 98.4 /100 | #73 | Exceptional 5.6% |
| Immigrants | North America | 98.3 /100 | #74 | Exceptional 5.6% |
| Slovenes | 98.3 /100 | #75 | Exceptional 5.6% |
| New Zealanders | 98.2 /100 | #76 | Exceptional 5.6% |
| Romanians | 98.1 /100 | #77 | Exceptional 5.6% |
| Swiss | 98.1 /100 | #78 | Exceptional 5.6% |