Nepalese vs Latvian Single Mother Households
COMPARE
Nepalese
Latvian
Single Mother Households
Single Mother Households Comparison
Nepalese
Latvians
7.5%
SINGLE MOTHER HOUSEHOLDS
0.1/ 100
METRIC RATING
266th/ 347
METRIC RANK
5.3%
SINGLE MOTHER HOUSEHOLDS
99.7/ 100
METRIC RATING
29th/ 347
METRIC RANK
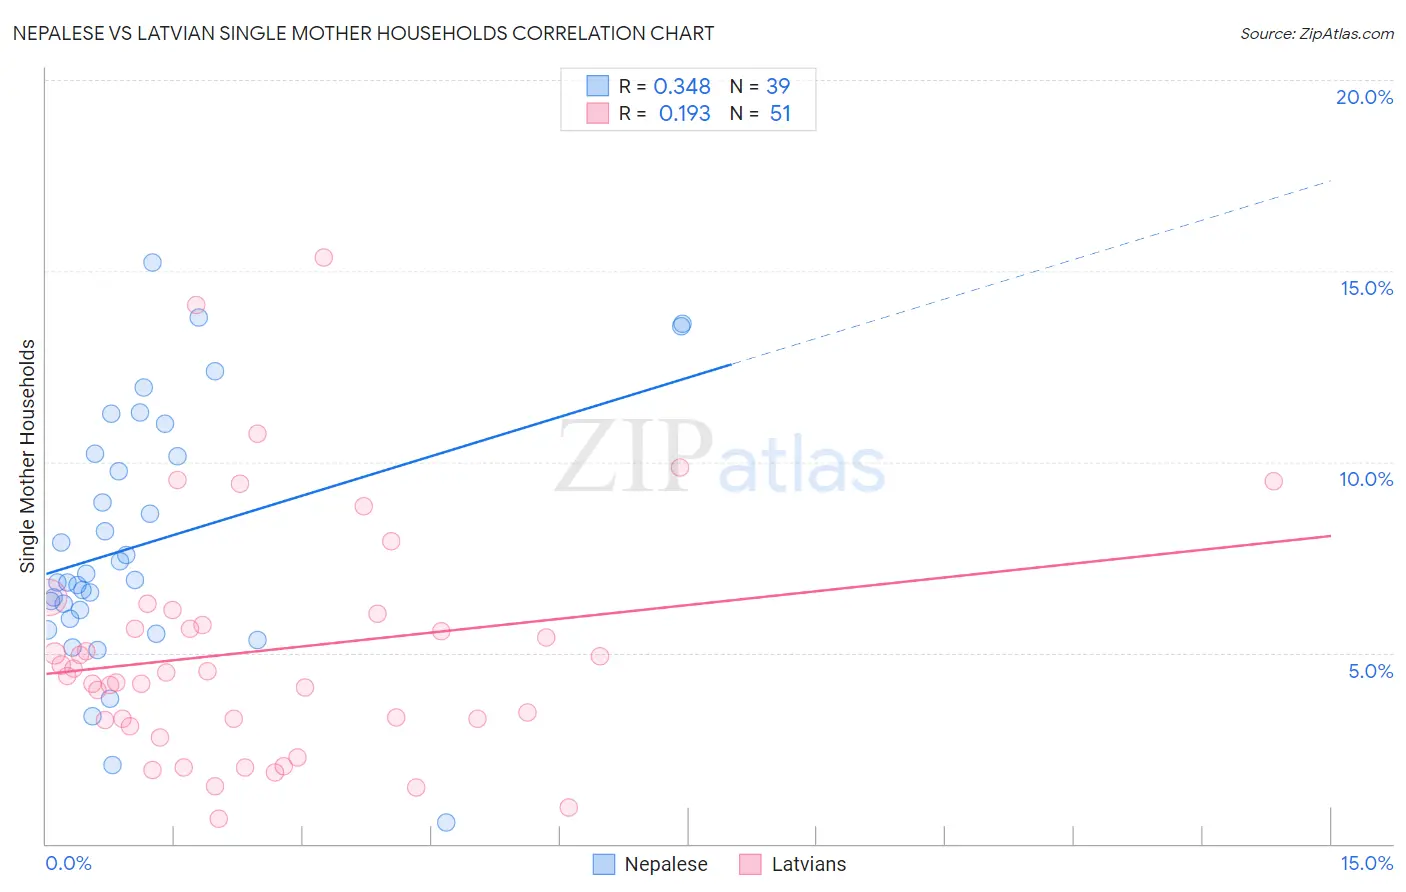
Nepalese vs Latvian Single Mother Households Correlation Chart
The statistical analysis conducted on geographies consisting of 24,517,800 people shows a mild positive correlation between the proportion of Nepalese and percentage of single mother households in the United States with a correlation coefficient (R) of 0.348 and weighted average of 7.5%. Similarly, the statistical analysis conducted on geographies consisting of 220,091,303 people shows a poor positive correlation between the proportion of Latvians and percentage of single mother households in the United States with a correlation coefficient (R) of 0.193 and weighted average of 5.3%, a difference of 41.1%.
Single Mother Households Correlation Summary
| Measurement | Nepalese | Latvian |
| Minimum | 0.56% | 0.66% |
| Maximum | 15.2% | 15.3% |
| Range | 14.7% | 14.7% |
| Mean | 7.9% | 5.1% |
| Median | 6.9% | 4.5% |
| Interquartile 25% (IQ1) | 5.9% | 3.3% |
| Interquartile 75% (IQ3) | 10.2% | 6.0% |
| Interquartile Range (IQR) | 4.3% | 2.8% |
| Standard Deviation (Sample) | 3.3% | 3.1% |
| Standard Deviation (Population) | 3.3% | 3.1% |
Similar Demographics by Single Mother Households
Demographics Similar to Nepalese by Single Mother Households
In terms of single mother households, the demographic groups most similar to Nepalese are Crow (7.4%, a difference of 0.090%), Yaqui (7.4%, a difference of 0.27%), Blackfeet (7.5%, a difference of 0.34%), Immigrants from Nicaragua (7.4%, a difference of 0.35%), and Indonesian (7.5%, a difference of 0.38%).
| Demographics | Rating | Rank | Single Mother Households |
| Immigrants | Yemen | 0.2 /100 | #259 | Tragic 7.4% |
| Immigrants | Zaire | 0.2 /100 | #260 | Tragic 7.4% |
| Japanese | 0.2 /100 | #261 | Tragic 7.4% |
| Immigrants | Somalia | 0.2 /100 | #262 | Tragic 7.4% |
| Immigrants | Nicaragua | 0.2 /100 | #263 | Tragic 7.4% |
| Yaqui | 0.1 /100 | #264 | Tragic 7.4% |
| Crow | 0.1 /100 | #265 | Tragic 7.4% |
| Nepalese | 0.1 /100 | #266 | Tragic 7.5% |
| Blackfeet | 0.1 /100 | #267 | Tragic 7.5% |
| Indonesians | 0.1 /100 | #268 | Tragic 7.5% |
| Somalis | 0.1 /100 | #269 | Tragic 7.5% |
| Immigrants | Cuba | 0.1 /100 | #270 | Tragic 7.5% |
| Salvadorans | 0.1 /100 | #271 | Tragic 7.5% |
| Immigrants | Azores | 0.1 /100 | #272 | Tragic 7.5% |
| Belizeans | 0.1 /100 | #273 | Tragic 7.6% |
Demographics Similar to Latvians by Single Mother Households
In terms of single mother households, the demographic groups most similar to Latvians are Russian (5.3%, a difference of 0.010%), Burmese (5.3%, a difference of 0.060%), Immigrants from Korea (5.3%, a difference of 0.070%), Cambodian (5.3%, a difference of 0.070%), and Bhutanese (5.3%, a difference of 0.12%).
| Demographics | Rating | Rank | Single Mother Households |
| Thais | 99.8 /100 | #22 | Exceptional 5.2% |
| Immigrants | Austria | 99.8 /100 | #23 | Exceptional 5.2% |
| Armenians | 99.8 /100 | #24 | Exceptional 5.2% |
| Immigrants | Japan | 99.8 /100 | #25 | Exceptional 5.2% |
| Immigrants | Lithuania | 99.8 /100 | #26 | Exceptional 5.3% |
| Bhutanese | 99.7 /100 | #27 | Exceptional 5.3% |
| Russians | 99.7 /100 | #28 | Exceptional 5.3% |
| Latvians | 99.7 /100 | #29 | Exceptional 5.3% |
| Burmese | 99.7 /100 | #30 | Exceptional 5.3% |
| Immigrants | Korea | 99.7 /100 | #31 | Exceptional 5.3% |
| Cambodians | 99.7 /100 | #32 | Exceptional 5.3% |
| Immigrants | Switzerland | 99.7 /100 | #33 | Exceptional 5.3% |
| Bulgarians | 99.7 /100 | #34 | Exceptional 5.3% |
| Immigrants | Northern Europe | 99.7 /100 | #35 | Exceptional 5.3% |
| Immigrants | Czechoslovakia | 99.7 /100 | #36 | Exceptional 5.3% |