Navajo vs Immigrants from Costa Rica Currently Married
COMPARE
Navajo
Immigrants from Costa Rica
Currently Married
Currently Married Comparison
Navajo
Immigrants from Costa Rica
39.0%
CURRENTLY MARRIED
0.0/ 100
METRIC RATING
341st/ 347
METRIC RANK
46.0%
CURRENTLY MARRIED
19.6/ 100
METRIC RATING
199th/ 347
METRIC RANK
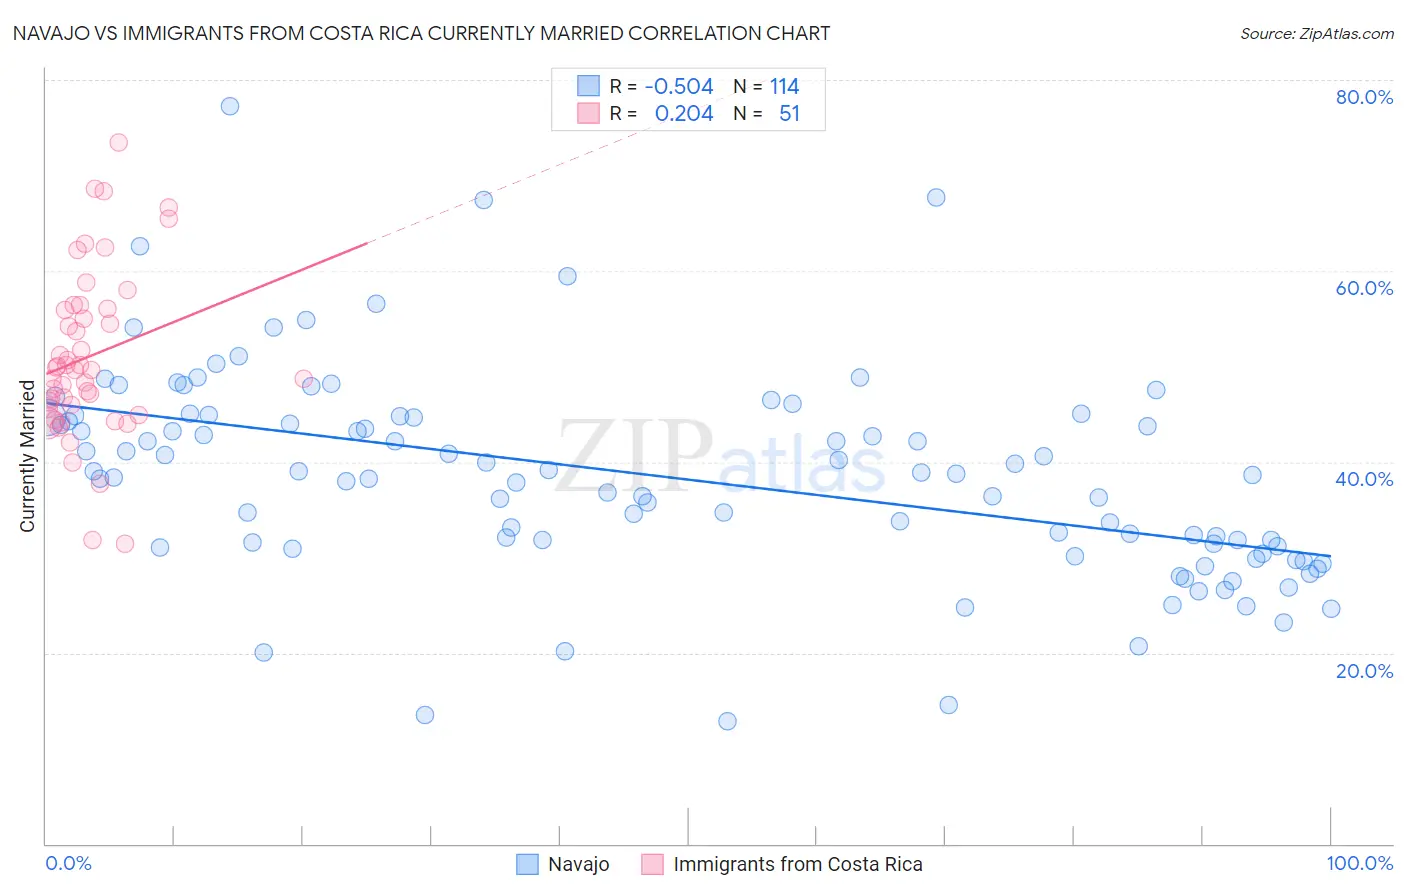
Navajo vs Immigrants from Costa Rica Currently Married Correlation Chart
The statistical analysis conducted on geographies consisting of 224,862,150 people shows a substantial negative correlation between the proportion of Navajo and percentage of population currently married in the United States with a correlation coefficient (R) of -0.504 and weighted average of 39.0%. Similarly, the statistical analysis conducted on geographies consisting of 204,268,650 people shows a weak positive correlation between the proportion of Immigrants from Costa Rica and percentage of population currently married in the United States with a correlation coefficient (R) of 0.204 and weighted average of 46.0%, a difference of 18.0%.
Currently Married Correlation Summary
| Measurement | Navajo | Immigrants from Costa Rica |
| Minimum | 12.8% | 31.4% |
| Maximum | 77.3% | 73.5% |
| Range | 64.5% | 42.1% |
| Mean | 38.4% | 51.0% |
| Median | 38.7% | 49.7% |
| Interquartile 25% (IQ1) | 31.1% | 45.7% |
| Interquartile 75% (IQ3) | 44.6% | 56.1% |
| Interquartile Range (IQR) | 13.5% | 10.4% |
| Standard Deviation (Sample) | 10.9% | 8.8% |
| Standard Deviation (Population) | 10.8% | 8.7% |
Similar Demographics by Currently Married
Demographics Similar to Navajo by Currently Married
In terms of currently married, the demographic groups most similar to Navajo are Immigrants from Dominican Republic (38.9%, a difference of 0.17%), Immigrants from Grenada (39.1%, a difference of 0.35%), Dominican (39.5%, a difference of 1.3%), Cape Verdean (39.6%, a difference of 1.5%), and Black/African American (39.6%, a difference of 1.6%).
| Demographics | Rating | Rank | Currently Married |
| Yup'ik | 0.0 /100 | #333 | Tragic 39.9% |
| Puerto Ricans | 0.0 /100 | #334 | Tragic 39.9% |
| Lumbee | 0.0 /100 | #335 | Tragic 39.8% |
| British West Indians | 0.0 /100 | #336 | Tragic 39.8% |
| Blacks/African Americans | 0.0 /100 | #337 | Tragic 39.6% |
| Cape Verdeans | 0.0 /100 | #338 | Tragic 39.6% |
| Dominicans | 0.0 /100 | #339 | Tragic 39.5% |
| Immigrants | Grenada | 0.0 /100 | #340 | Tragic 39.1% |
| Navajo | 0.0 /100 | #341 | Tragic 39.0% |
| Immigrants | Dominican Republic | 0.0 /100 | #342 | Tragic 38.9% |
| Pueblo | 0.0 /100 | #343 | Tragic 38.2% |
| Immigrants | Cabo Verde | 0.0 /100 | #344 | Tragic 37.8% |
| Tohono O'odham | 0.0 /100 | #345 | Tragic 36.8% |
| Hopi | 0.0 /100 | #346 | Tragic 36.5% |
| Pima | 0.0 /100 | #347 | Tragic 35.9% |
Demographics Similar to Immigrants from Costa Rica by Currently Married
In terms of currently married, the demographic groups most similar to Immigrants from Costa Rica are Immigrants from Colombia (46.1%, a difference of 0.080%), Immigrants from Kuwait (46.1%, a difference of 0.12%), Creek (46.0%, a difference of 0.14%), Immigrants from Bosnia and Herzegovina (46.1%, a difference of 0.15%), and South American (46.1%, a difference of 0.23%).
| Demographics | Rating | Rank | Currently Married |
| Soviet Union | 25.7 /100 | #192 | Fair 46.2% |
| Immigrants | Fiji | 25.0 /100 | #193 | Fair 46.2% |
| South Americans | 23.8 /100 | #194 | Fair 46.1% |
| Immigrants | Nepal | 23.7 /100 | #195 | Fair 46.1% |
| Immigrants | Bosnia and Herzegovina | 22.2 /100 | #196 | Fair 46.1% |
| Immigrants | Kuwait | 21.7 /100 | #197 | Fair 46.1% |
| Immigrants | Colombia | 21.0 /100 | #198 | Fair 46.1% |
| Immigrants | Costa Rica | 19.6 /100 | #199 | Poor 46.0% |
| Creek | 17.2 /100 | #200 | Poor 46.0% |
| Malaysians | 15.3 /100 | #201 | Poor 45.9% |
| Immigrants | Albania | 14.5 /100 | #202 | Poor 45.9% |
| Taiwanese | 11.7 /100 | #203 | Poor 45.8% |
| Immigrants | Spain | 11.6 /100 | #204 | Poor 45.8% |
| South American Indians | 11.5 /100 | #205 | Poor 45.8% |
| Immigrants | Immigrants | 11.2 /100 | #206 | Poor 45.8% |