Native/Alaskan vs Romanian Family Households
COMPARE
Native/Alaskan
Romanian
Family Households
Family Households Comparison
Natives/Alaskans
Romanians
66.4%
FAMILY HOUSEHOLDS
100.0/ 100
METRIC RATING
51st/ 347
METRIC RANK
64.5%
FAMILY HOUSEHOLDS
75.3/ 100
METRIC RATING
150th/ 347
METRIC RANK
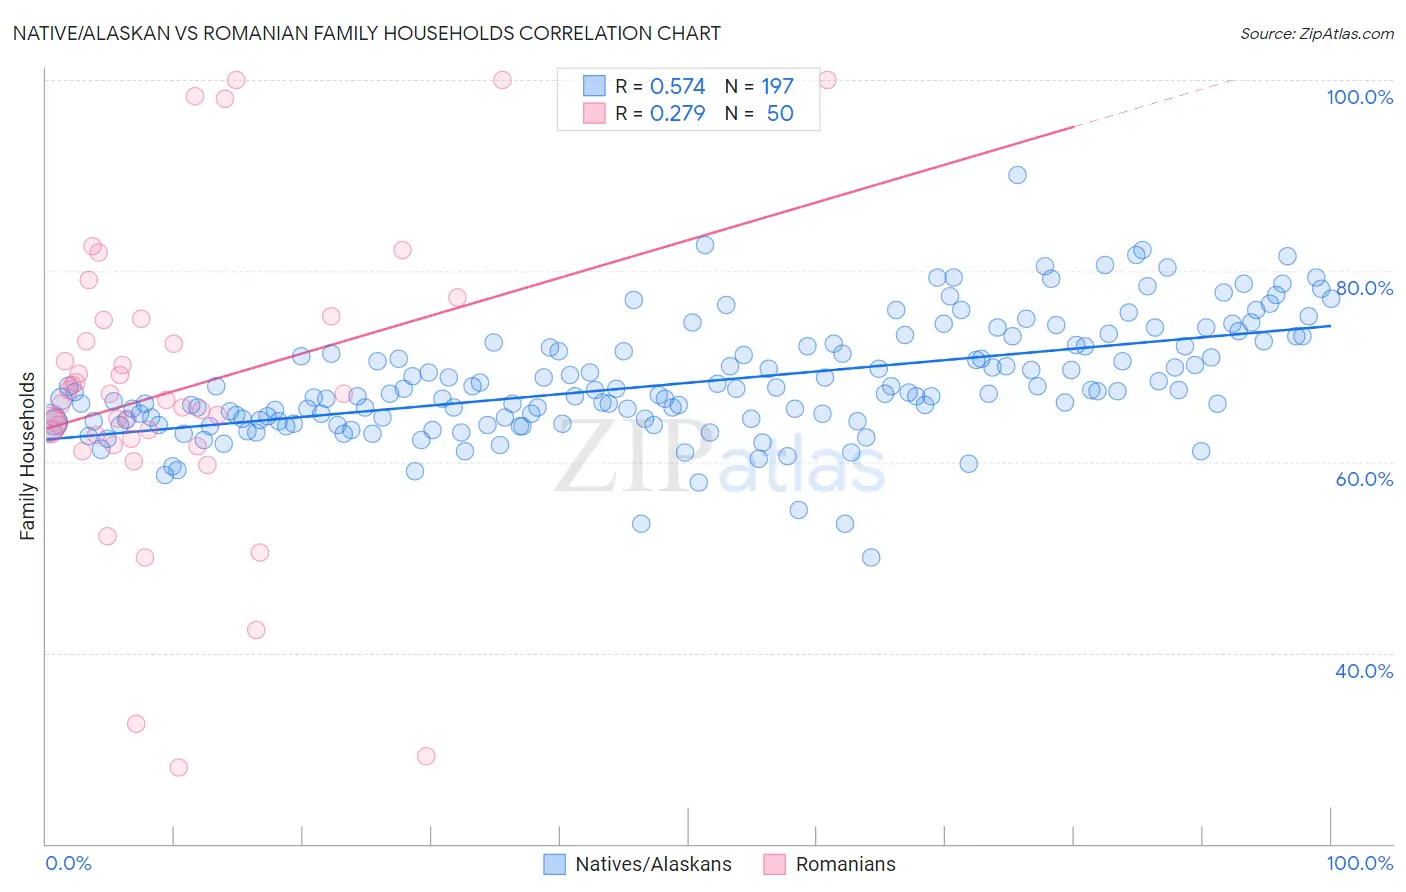
Native/Alaskan vs Romanian Family Households Correlation Chart
The statistical analysis conducted on geographies consisting of 512,654,863 people shows a substantial positive correlation between the proportion of Natives/Alaskans and percentage of family households in the United States with a correlation coefficient (R) of 0.574 and weighted average of 66.4%. Similarly, the statistical analysis conducted on geographies consisting of 377,713,202 people shows a weak positive correlation between the proportion of Romanians and percentage of family households in the United States with a correlation coefficient (R) of 0.279 and weighted average of 64.5%, a difference of 2.8%.
Family Households Correlation Summary
| Measurement | Native/Alaskan | Romanian |
| Minimum | 49.9% | 27.9% |
| Maximum | 90.0% | 100.0% |
| Range | 40.1% | 72.1% |
| Mean | 68.3% | 67.6% |
| Median | 67.2% | 66.2% |
| Interquartile 25% (IQ1) | 64.2% | 62.4% |
| Interquartile 75% (IQ3) | 72.1% | 74.9% |
| Interquartile Range (IQR) | 7.9% | 12.4% |
| Standard Deviation (Sample) | 6.0% | 15.8% |
| Standard Deviation (Population) | 6.0% | 15.7% |
Similar Demographics by Family Households
Demographics Similar to Natives/Alaskans by Family Households
In terms of family households, the demographic groups most similar to Natives/Alaskans are Navajo (66.4%, a difference of 0.030%), Immigrants from South Central Asia (66.4%, a difference of 0.090%), Immigrants from Venezuela (66.4%, a difference of 0.14%), Colombian (66.3%, a difference of 0.14%), and Afghan (66.3%, a difference of 0.14%).
| Demographics | Rating | Rank | Family Households |
| Asians | 100.0 /100 | #44 | Exceptional 66.5% |
| Venezuelans | 100.0 /100 | #45 | Exceptional 66.5% |
| Arapaho | 100.0 /100 | #46 | Exceptional 66.5% |
| Bolivians | 100.0 /100 | #47 | Exceptional 66.5% |
| Immigrants | Venezuela | 100.0 /100 | #48 | Exceptional 66.4% |
| Immigrants | South Central Asia | 100.0 /100 | #49 | Exceptional 66.4% |
| Navajo | 100.0 /100 | #50 | Exceptional 66.4% |
| Natives/Alaskans | 100.0 /100 | #51 | Exceptional 66.4% |
| Colombians | 100.0 /100 | #52 | Exceptional 66.3% |
| Afghans | 100.0 /100 | #53 | Exceptional 66.3% |
| Immigrants | Colombia | 100.0 /100 | #54 | Exceptional 66.3% |
| Immigrants | Immigrants | 100.0 /100 | #55 | Exceptional 66.1% |
| Immigrants | Hong Kong | 100.0 /100 | #56 | Exceptional 66.1% |
| Pennsylvania Germans | 100.0 /100 | #57 | Exceptional 66.1% |
| Immigrants | Asia | 100.0 /100 | #58 | Exceptional 66.1% |
Demographics Similar to Romanians by Family Households
In terms of family households, the demographic groups most similar to Romanians are Syrian (64.5%, a difference of 0.0%), Immigrants from Chile (64.6%, a difference of 0.020%), Delaware (64.6%, a difference of 0.020%), Sioux (64.6%, a difference of 0.020%), and Immigrants from Romania (64.6%, a difference of 0.030%).
| Demographics | Rating | Rank | Family Households |
| Czechoslovakians | 82.1 /100 | #143 | Excellent 64.6% |
| South American Indians | 81.9 /100 | #144 | Excellent 64.6% |
| Welsh | 80.1 /100 | #145 | Excellent 64.6% |
| Immigrants | Romania | 77.0 /100 | #146 | Good 64.6% |
| Immigrants | Chile | 76.5 /100 | #147 | Good 64.6% |
| Delaware | 76.3 /100 | #148 | Good 64.6% |
| Sioux | 76.3 /100 | #149 | Good 64.6% |
| Romanians | 75.3 /100 | #150 | Good 64.5% |
| Syrians | 75.2 /100 | #151 | Good 64.5% |
| Scottish | 70.9 /100 | #152 | Good 64.5% |
| Swedes | 69.8 /100 | #153 | Good 64.5% |
| Austrians | 68.5 /100 | #154 | Good 64.5% |
| Uruguayans | 67.7 /100 | #155 | Good 64.5% |
| Czechs | 67.0 /100 | #156 | Good 64.5% |
| Canadians | 66.6 /100 | #157 | Good 64.4% |