Moroccan vs Iraqi Family Households with Children

COMPARE

Moroccan
Race
Ancestry
AfghanAfricanAlaska NativeAlaskan AthabascanAlbanianAleutAlsatianAmericanApacheArabArapahoArgentineanArmenianAssyrian/Chaldean/SyriacAustralianAustrianBahamianBangladeshiBarbadianBasqueBelgianBelizeanBermudanBhutaneseBlackfeetBolivianBrazilianBritishBritish West IndianBulgarianBurmeseCajunCambodianCanadianCape VerdeanCarpatho RusynCelticCentral AmericanCentral American IndianCherokeeCheyenneChickasawChileanChineseChippewaChoctawColombianColvilleComancheCosta RicanCreeCreekCroatianCrowCubanCypriotCzechCzechoslovakianDanishDelawareDominicanDutchDutch West IndianEastern EuropeanEcuadorianEgyptianEnglishEstonianEthiopianEuropeanFijianFilipinoFinnishFrenchFrench American IndianFrench CanadianGermanGerman RussianGhanaianGreekGuamanian/ChamorroGuatemalanGuyaneseHaitianHmongHonduranHopiHoumaHungarianIcelanderIndian (Asian)IndonesianInupiatIranianIrishIroquoisIsraeliItalianJamaicanJapaneseJordanianKenyanKiowaKoreanLaotianLatvianLebaneseLiberianLithuanianLumbeeLuxembourgerMacedonianMalaysianMalteseMarshalleseMenomineeMexicanMexican American IndianMongolianMoroccanNative HawaiianNavajoNepaleseNew ZealanderNicaraguanNigerianNorthern EuropeanNorwegianOkinawanOsageOttawaPaiutePakistaniPalestinianPanamanianParaguayanPennsylvania GermanPeruvianPimaPolishPortuguesePotawatomiPuebloPuerto RicanPuget Sound SalishRomanianRussianSalvadoranSamoanScandinavianScotch-IrishScottishSeminoleSenegaleseSerbianShoshoneSierra LeoneanSiouxSlavicSlovakSloveneSomaliSouth AfricanSouth AmericanSouth American IndianSoviet UnionSpaniardSpanishSpanish AmericanSpanish American IndianSri LankanSubsaharan AfricanSudaneseSwedishSwissSyrianTaiwaneseThaiTlingit-HaidaTohono O'OdhamTonganTrinidadian and TobagonianTsimshianTurkishU.S. Virgin IslanderUgandanUkrainianUruguayanUteVenezuelanVietnameseWelshWest IndianYakamaYaquiYugoslavianYumanYup'ikZimbabwean
Immigration
NonimmigrantsImmigrantsAfghanistanAfricaAlbaniaArgentinaArmeniaAsiaAustraliaAustriaBahamasBangladeshBarbadosBelarusBelgiumBelizeBoliviaBosnia and HerzegovinaBrazilBulgariaBurma/MyanmarCabo VerdeCambodiaCameroonCanadaCaribbeanCentral AmericaChileChinaColombiaCongoCosta RicaCroatiaCubaCzechoslovakiaDenmarkDominicaDominican RepublicEastern AfricaEastern AsiaEastern EuropeEcuadorEgyptEl SalvadorEnglandEritreaEthiopiaEuropeFijiFranceGermanyGhanaGreeceGrenadaGuatemalaGuyanaHaitiHondurasHong KongHungaryIndiaIndonesiaIranIraqIrelandIsraelItalyJamaicaJapanJordanKazakhstanKenyaKoreaKuwaitLaosLatin AmericaLatviaLebanonLiberiaLithuaniaMalaysiaMexicoMicronesiaMiddle AfricaMoldovaMoroccoNepalNetherlandsNicaraguaNigeriaNorth AmericaNorth MacedoniaNorthern AfricaNorthern EuropeNorwayOceaniaPakistanPanamaPeruPhilippinesPolandPortugalRomaniaRussiaSaudi ArabiaScotlandSenegalSerbiaSierra LeoneSingaporeSomaliaSouth AfricaSouth AmericaSouth Central AsiaSouth Eastern AsiaSouthern EuropeSpainSri LankaSt. Vincent and the GrenadinesSudanSwedenSwitzerlandSyriaTaiwanThailandTrinidad and TobagoTurkeyUgandaUkraineUruguayUzbekistanVenezuelaVietnamWest IndiesWestern AfricaWestern AsiaWestern EuropeYemenZaireZimbabweAzores
Iraqi
Race
Ancestry
AfghanAfricanAlaska NativeAlaskan AthabascanAlbanianAleutAlsatianAmericanApacheArabArapahoArgentineanArmenianAssyrian/Chaldean/SyriacAustralianAustrianBahamianBangladeshiBarbadianBasqueBelgianBelizeanBermudanBhutaneseBlackfeetBolivianBrazilianBritishBritish West IndianBulgarianBurmeseCajunCambodianCanadianCape VerdeanCarpatho RusynCelticCentral AmericanCentral American IndianCherokeeCheyenneChickasawChileanChineseChippewaChoctawColombianColvilleComancheCosta RicanCreeCreekCroatianCrowCubanCypriotCzechCzechoslovakianDanishDelawareDominicanDutchDutch West IndianEastern EuropeanEcuadorianEgyptianEnglishEstonianEthiopianEuropeanFijianFilipinoFinnishFrenchFrench American IndianFrench CanadianGermanGerman RussianGhanaianGreekGuamanian/ChamorroGuatemalanGuyaneseHaitianHmongHonduranHopiHoumaHungarianIcelanderIndian (Asian)IndonesianInupiatIranianIraqiIrishIroquoisIsraeliItalianJamaicanJapaneseJordanianKenyanKiowaKoreanLaotianLatvianLebaneseLiberianLithuanianLumbeeLuxembourgerMacedonianMalaysianMalteseMarshalleseMenomineeMexicanMexican American IndianMongolianNative HawaiianNavajoNepaleseNew ZealanderNicaraguanNigerianNorthern EuropeanNorwegianOkinawanOsageOttawaPaiutePakistaniPalestinianPanamanianParaguayanPennsylvania GermanPeruvianPimaPolishPortuguesePotawatomiPuebloPuerto RicanPuget Sound SalishRomanianRussianSalvadoranSamoanScandinavianScotch-IrishScottishSeminoleSenegaleseSerbianShoshoneSierra LeoneanSiouxSlavicSlovakSloveneSomaliSouth AfricanSouth AmericanSouth American IndianSoviet UnionSpaniardSpanishSpanish AmericanSpanish American IndianSri LankanSubsaharan AfricanSudaneseSwedishSwissSyrianTaiwaneseThaiTlingit-HaidaTohono O'OdhamTonganTrinidadian and TobagonianTsimshianTurkishU.S. Virgin IslanderUgandanUkrainianUruguayanUteVenezuelanVietnameseWelshWest IndianYakamaYaquiYugoslavianYumanYup'ikZimbabwean
Immigration
NonimmigrantsImmigrantsAfghanistanAfricaAlbaniaArgentinaArmeniaAsiaAustraliaAustriaBahamasBangladeshBarbadosBelarusBelgiumBelizeBoliviaBosnia and HerzegovinaBrazilBulgariaBurma/MyanmarCabo VerdeCambodiaCameroonCanadaCaribbeanCentral AmericaChileChinaColombiaCongoCosta RicaCroatiaCubaCzechoslovakiaDenmarkDominicaDominican RepublicEastern AfricaEastern AsiaEastern EuropeEcuadorEgyptEl SalvadorEnglandEritreaEthiopiaEuropeFijiFranceGermanyGhanaGreeceGrenadaGuatemalaGuyanaHaitiHondurasHong KongHungaryIndiaIndonesiaIranIraqIrelandIsraelItalyJamaicaJapanJordanKazakhstanKenyaKoreaKuwaitLaosLatin AmericaLatviaLebanonLiberiaLithuaniaMalaysiaMexicoMicronesiaMiddle AfricaMoldovaMoroccoNepalNetherlandsNicaraguaNigeriaNorth AmericaNorth MacedoniaNorthern AfricaNorthern EuropeNorwayOceaniaPakistanPanamaPeruPhilippinesPolandPortugalRomaniaRussiaSaudi ArabiaScotlandSenegalSerbiaSierra LeoneSingaporeSomaliaSouth AfricaSouth AmericaSouth Central AsiaSouth Eastern AsiaSouthern EuropeSpainSri LankaSt. Vincent and the GrenadinesSudanSwedenSwitzerlandSyriaTaiwanThailandTrinidad and TobagoTurkeyUgandaUkraineUruguayUzbekistanVenezuelaVietnamWest IndiesWestern AfricaWestern AsiaWestern EuropeYemenZaireZimbabweAzores
Family Households with Children
Income
Poverty
Unemployment
Labor Participation
Family Structure
Vehicle Availability
Education Level
Disability

Family Households with Children Comparison

Moroccans

Iraqis

Tragic
Exceptional
26.9%
FAMILY HOUSEHOLDS WITH CHILDREN
3.4/ 100
METRIC RATING
238th/ 347
METRIC RANK
28.5%
FAMILY HOUSEHOLDS WITH CHILDREN
99.9/ 100
METRIC RATING
73rd/ 347
METRIC RANK

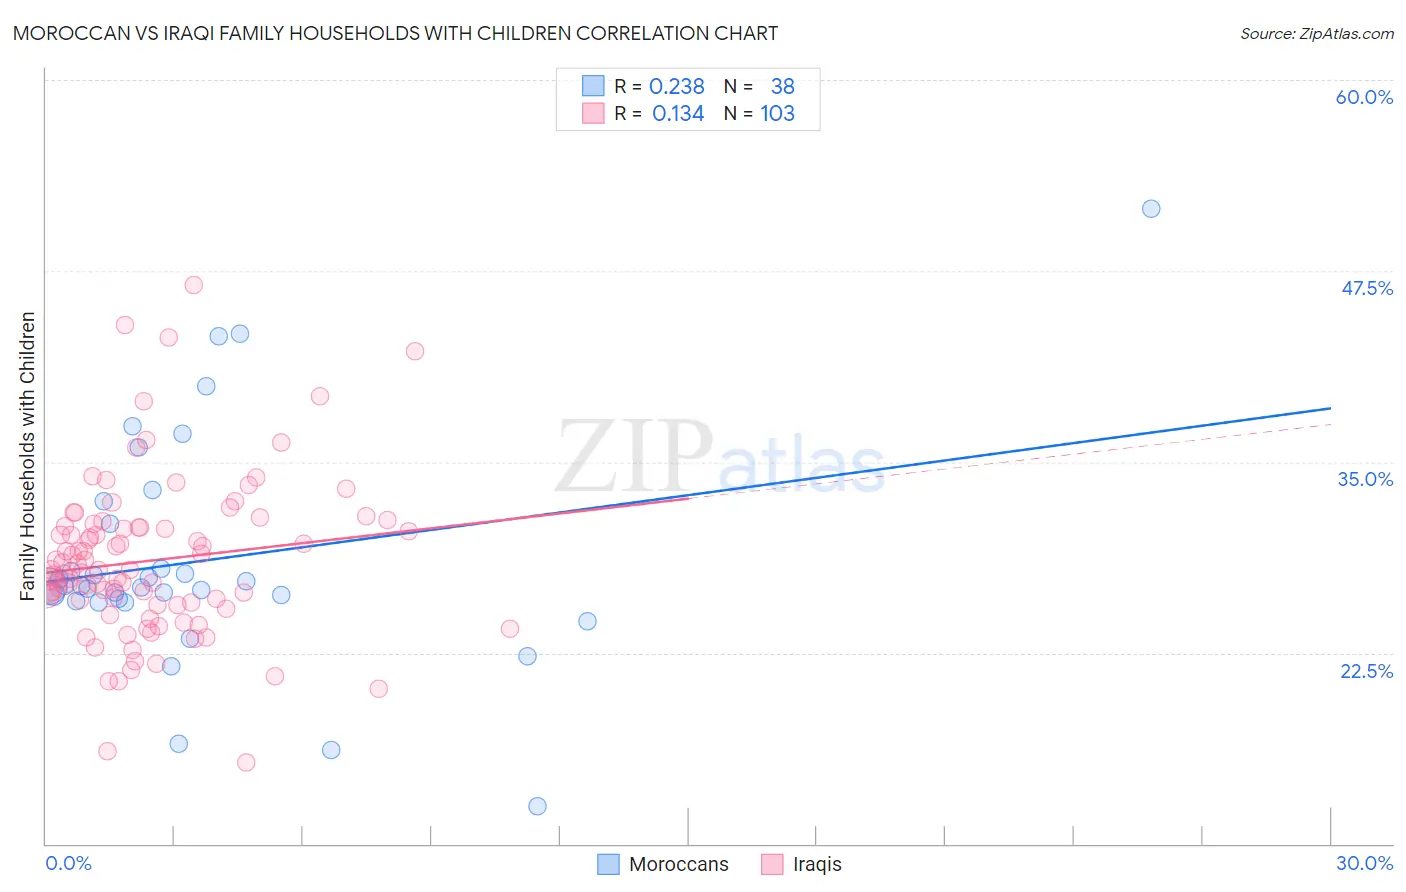
Moroccan vs Iraqi Family Households with Children Correlation Chart

The statistical analysis conducted on geographies consisting of 201,690,181 people shows a weak positive correlation between the proportion of Moroccans and percentage of family households with children in the United States with a correlation coefficient (R) of 0.238 and weighted average of 26.9%. Similarly, the statistical analysis conducted on geographies consisting of 170,533,912 people shows a poor positive correlation between the proportion of Iraqis and percentage of family households with children in the United States with a correlation coefficient (R) of 0.134 and weighted average of 28.5%, a difference of 5.7%.
Moroccan vs Iraqi Family Households with Children

Family Households with Children Correlation Summary

MeasurementMoroccanIraqi
Minimum12.4%15.3%
Maximum51.6%46.5%
Range39.1%31.3%
Mean28.5%28.5%
Median26.9%27.9%
Interquartile 25% (IQ1)25.9%25.6%
Interquartile 75% (IQ3)31.0%30.8%
Interquartile Range (IQR)5.1%5.2%
Standard Deviation (Sample)7.5%5.2%
Standard Deviation (Population)7.4%5.2%

Similar Demographics by Family Households with Children

Demographics Similar to Moroccans by Family Households with Children

In terms of family households with children, the demographic groups most similar to Moroccans are Immigrants from Netherlands (26.9%, a difference of 0.010%), Immigrants from Southern Europe (26.9%, a difference of 0.010%), Cape Verdean (26.9%, a difference of 0.020%), Immigrants from Bulgaria (26.9%, a difference of 0.020%), and Navajo (26.9%, a difference of 0.030%).
DemographicsRating | RankFamily Households with Children
Luxembourgers
5.5
/100
|
#231
Tragic
27.0%
Yugoslavians
5.1
/100
|
#232
Tragic
27.0%
Immigrants | Italy
5.0
/100
|
#233
Tragic
27.0%
Immigrants | Germany
4.4
/100
|
#234
Tragic
27.0%
Immigrants | Morocco
4.2
/100
|
#235
Tragic
27.0%
Cape Verdeans
3.6
/100
|
#236
Tragic
26.9%
Immigrants | Netherlands
3.5
/100
|
#237
Tragic
26.9%
Moroccans
3.4
/100
|
#238
Tragic
26.9%
Immigrants | Southern Europe
3.4
/100
|
#239
Tragic
26.9%
Immigrants | Bulgaria
3.3
/100
|
#240
Tragic
26.9%
Navajo
3.2
/100
|
#241
Tragic
26.9%
Immigrants | England
3.2
/100
|
#242
Tragic
26.9%
Immigrants | Saudi Arabia
2.9
/100
|
#243
Tragic
26.9%
Ukrainians
2.9
/100
|
#244
Tragic
26.9%
Australians
2.8
/100
|
#245
Tragic
26.9%

Demographics Similar to Iraqis by Family Households with Children

In terms of family households with children, the demographic groups most similar to Iraqis are Laotian (28.5%, a difference of 0.010%), Immigrants from Indonesia (28.5%, a difference of 0.030%), Burmese (28.5%, a difference of 0.040%), Immigrants from Honduras (28.5%, a difference of 0.050%), and Immigrants from Korea (28.5%, a difference of 0.11%).
DemographicsRating | RankFamily Households with Children
Immigrants | Egypt
99.9
/100
|
#66
Exceptional
28.5%
Ghanaians
99.9
/100
|
#67
Exceptional
28.5%
Houma
99.9
/100
|
#68
Exceptional
28.5%
Immigrants | Korea
99.9
/100
|
#69
Exceptional
28.5%
Immigrants | Honduras
99.9
/100
|
#70
Exceptional
28.5%
Burmese
99.9
/100
|
#71
Exceptional
28.5%
Immigrants | Indonesia
99.9
/100
|
#72
Exceptional
28.5%
Iraqis
99.9
/100
|
#73
Exceptional
28.5%
Laotians
99.9
/100
|
#74
Exceptional
28.5%
Immigrants | Jordan
99.9
/100
|
#75
Exceptional
28.4%
Immigrants | Sri Lanka
99.9
/100
|
#76
Exceptional
28.4%
Nigerians
99.8
/100
|
#77
Exceptional
28.4%
Immigrants | Nepal
99.8
/100
|
#78
Exceptional
28.4%
Immigrants | Iraq
99.8
/100
|
#79
Exceptional
28.4%
Natives/Alaskans
99.8
/100
|
#80
Exceptional
28.4%