Maltese vs Immigrants from Western Africa Single Mother Households

COMPARE

Maltese
Race
Ancestry
AfghanAfricanAlaska NativeAlaskan AthabascanAlbanianAleutAlsatianAmericanApacheArabArapahoArgentineanArmenianAssyrian/Chaldean/SyriacAustralianAustrianBahamianBangladeshiBarbadianBasqueBelgianBelizeanBermudanBhutaneseBlackfeetBolivianBrazilianBritishBritish West IndianBulgarianBurmeseCajunCambodianCanadianCape VerdeanCarpatho RusynCelticCentral AmericanCentral American IndianCherokeeCheyenneChickasawChileanChineseChippewaChoctawColombianColvilleComancheCosta RicanCreeCreekCroatianCrowCubanCypriotCzechCzechoslovakianDanishDelawareDominicanDutchDutch West IndianEastern EuropeanEcuadorianEgyptianEnglishEstonianEthiopianEuropeanFijianFilipinoFinnishFrenchFrench American IndianFrench CanadianGermanGerman RussianGhanaianGreekGuamanian/ChamorroGuatemalanGuyaneseHaitianHmongHonduranHopiHoumaHungarianIcelanderIndian (Asian)IndonesianInupiatIranianIraqiIrishIroquoisIsraeliItalianJamaicanJapaneseJordanianKenyanKiowaKoreanLaotianLatvianLebaneseLiberianLithuanianLumbeeLuxembourgerMacedonianMalaysianMalteseMarshalleseMenomineeMexicanMexican American IndianMongolianMoroccanNative HawaiianNavajoNepaleseNew ZealanderNicaraguanNigerianNorthern EuropeanNorwegianOkinawanOsageOttawaPaiutePakistaniPalestinianPanamanianParaguayanPennsylvania GermanPeruvianPimaPolishPortuguesePotawatomiPuebloPuerto RicanPuget Sound SalishRomanianRussianSalvadoranSamoanScandinavianScotch-IrishScottishSeminoleSenegaleseSerbianShoshoneSierra LeoneanSiouxSlavicSlovakSloveneSomaliSouth AfricanSouth AmericanSouth American IndianSoviet UnionSpaniardSpanishSpanish AmericanSpanish American IndianSri LankanSubsaharan AfricanSudaneseSwedishSwissSyrianTaiwaneseThaiTlingit-HaidaTohono O'OdhamTonganTrinidadian and TobagonianTsimshianTurkishU.S. Virgin IslanderUgandanUkrainianUruguayanUteVenezuelanVietnameseWelshWest IndianYakamaYaquiYugoslavianYumanYup'ikZimbabwean
Immigration
NonimmigrantsImmigrantsAfghanistanAfricaAlbaniaArgentinaArmeniaAsiaAustraliaAustriaBahamasBangladeshBarbadosBelarusBelgiumBelizeBoliviaBosnia and HerzegovinaBrazilBulgariaBurma/MyanmarCabo VerdeCambodiaCameroonCanadaCaribbeanCentral AmericaChileChinaColombiaCongoCosta RicaCroatiaCubaCzechoslovakiaDenmarkDominicaDominican RepublicEastern AfricaEastern AsiaEastern EuropeEcuadorEgyptEl SalvadorEnglandEritreaEthiopiaEuropeFijiFranceGermanyGhanaGreeceGrenadaGuatemalaGuyanaHaitiHondurasHong KongHungaryIndiaIndonesiaIranIraqIrelandIsraelItalyJamaicaJapanJordanKazakhstanKenyaKoreaKuwaitLaosLatin AmericaLatviaLebanonLiberiaLithuaniaMalaysiaMexicoMicronesiaMiddle AfricaMoldovaMoroccoNepalNetherlandsNicaraguaNigeriaNorth AmericaNorth MacedoniaNorthern AfricaNorthern EuropeNorwayOceaniaPakistanPanamaPeruPhilippinesPolandPortugalRomaniaRussiaSaudi ArabiaScotlandSenegalSerbiaSierra LeoneSingaporeSomaliaSouth AfricaSouth AmericaSouth Central AsiaSouth Eastern AsiaSouthern EuropeSpainSri LankaSt. Vincent and the GrenadinesSudanSwedenSwitzerlandSyriaTaiwanThailandTrinidad and TobagoTurkeyUgandaUkraineUruguayUzbekistanVenezuelaVietnamWest IndiesWestern AsiaWestern EuropeYemenZaireZimbabweAzores
Immigrants from Western Africa
Race
Ancestry
AfghanAfricanAlaska NativeAlaskan AthabascanAlbanianAleutAlsatianAmericanApacheArabArapahoArgentineanArmenianAssyrian/Chaldean/SyriacAustralianAustrianBahamianBangladeshiBarbadianBasqueBelgianBelizeanBermudanBhutaneseBlackfeetBolivianBrazilianBritishBritish West IndianBulgarianBurmeseCajunCambodianCanadianCape VerdeanCarpatho RusynCelticCentral AmericanCentral American IndianCherokeeCheyenneChickasawChileanChineseChippewaChoctawColombianColvilleComancheCosta RicanCreeCreekCroatianCrowCubanCypriotCzechCzechoslovakianDanishDelawareDominicanDutchDutch West IndianEastern EuropeanEcuadorianEgyptianEnglishEstonianEthiopianEuropeanFijianFilipinoFinnishFrenchFrench American IndianFrench CanadianGermanGerman RussianGhanaianGreekGuamanian/ChamorroGuatemalanGuyaneseHaitianHmongHonduranHopiHoumaHungarianIcelanderIndian (Asian)IndonesianInupiatIranianIraqiIrishIroquoisIsraeliItalianJamaicanJapaneseJordanianKenyanKiowaKoreanLaotianLatvianLebaneseLiberianLithuanianLumbeeLuxembourgerMacedonianMalaysianMarshalleseMenomineeMexicanMexican American IndianMongolianMoroccanNative HawaiianNavajoNepaleseNew ZealanderNicaraguanNigerianNorthern EuropeanNorwegianOkinawanOsageOttawaPaiutePakistaniPalestinianPanamanianParaguayanPennsylvania GermanPeruvianPimaPolishPortuguesePotawatomiPuebloPuerto RicanPuget Sound SalishRomanianRussianSalvadoranSamoanScandinavianScotch-IrishScottishSeminoleSenegaleseSerbianShoshoneSierra LeoneanSiouxSlavicSlovakSloveneSomaliSouth AfricanSouth AmericanSouth American IndianSoviet UnionSpaniardSpanishSpanish AmericanSpanish American IndianSri LankanSubsaharan AfricanSudaneseSwedishSwissSyrianTaiwaneseThaiTlingit-HaidaTohono O'OdhamTonganTrinidadian and TobagonianTsimshianTurkishU.S. Virgin IslanderUgandanUkrainianUruguayanUteVenezuelanVietnameseWelshWest IndianYakamaYaquiYugoslavianYumanYup'ikZimbabwean
Immigration
NonimmigrantsImmigrantsAfghanistanAfricaAlbaniaArgentinaArmeniaAsiaAustraliaAustriaBahamasBangladeshBarbadosBelarusBelgiumBelizeBoliviaBosnia and HerzegovinaBrazilBulgariaBurma/MyanmarCabo VerdeCambodiaCameroonCanadaCaribbeanCentral AmericaChileChinaColombiaCongoCosta RicaCroatiaCubaCzechoslovakiaDenmarkDominicaDominican RepublicEastern AfricaEastern AsiaEastern EuropeEcuadorEgyptEl SalvadorEnglandEritreaEthiopiaEuropeFijiFranceGermanyGhanaGreeceGrenadaGuatemalaGuyanaHaitiHondurasHong KongHungaryIndiaIndonesiaIranIraqIrelandIsraelItalyJamaicaJapanJordanKazakhstanKenyaKoreaKuwaitLaosLatin AmericaLatviaLebanonLiberiaLithuaniaMalaysiaMexicoMicronesiaMiddle AfricaMoldovaMoroccoNepalNetherlandsNicaraguaNigeriaNorth AmericaNorth MacedoniaNorthern AfricaNorthern EuropeNorwayOceaniaPakistanPanamaPeruPhilippinesPolandPortugalRomaniaRussiaSaudi ArabiaScotlandSenegalSerbiaSierra LeoneSingaporeSomaliaSouth AfricaSouth AmericaSouth Central AsiaSouth Eastern AsiaSouthern EuropeSpainSri LankaSt. Vincent and the GrenadinesSudanSwedenSwitzerlandSyriaTaiwanThailandTrinidad and TobagoTurkeyUgandaUkraineUruguayUzbekistanVenezuelaVietnamWest IndiesWestern AfricaWestern AsiaWestern EuropeYemenZaireZimbabweAzores
Single Mother Households
Income
Poverty
Unemployment
Labor Participation
Family Structure
Vehicle Availability
Education Level
Disability

Single Mother Households Comparison

Maltese

Immigrants from Western Africa

Exceptional
Tragic
5.2%
SINGLE MOTHER HOUSEHOLDS
99.9/ 100
METRIC RATING
20th/ 347
METRIC RANK
8.2%
SINGLE MOTHER HOUSEHOLDS
0.0/ 100
METRIC RATING
315th/ 347
METRIC RANK

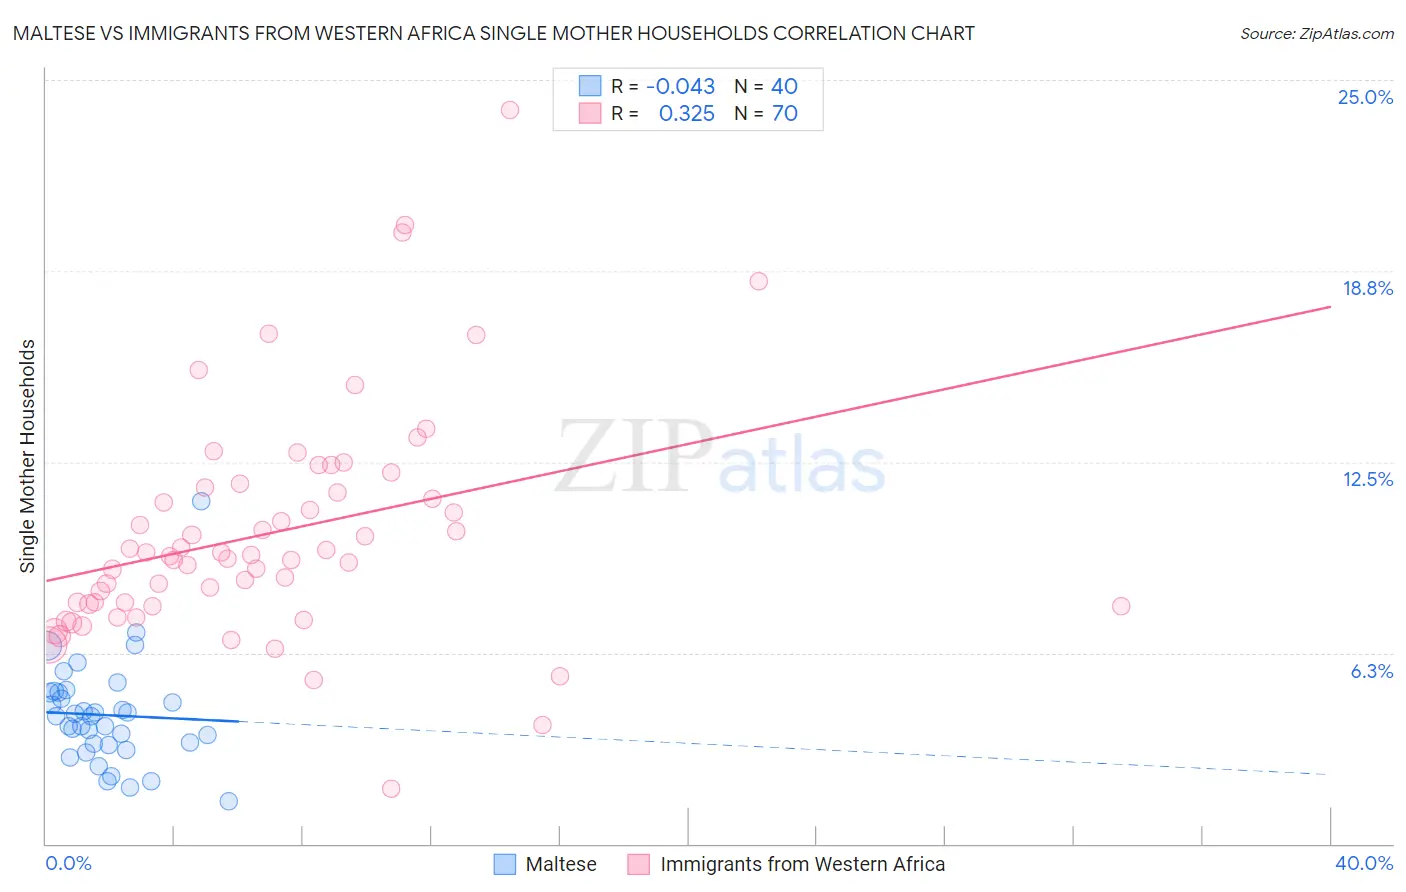
Maltese vs Immigrants from Western Africa Single Mother Households Correlation Chart

The statistical analysis conducted on geographies consisting of 126,155,970 people shows no correlation between the proportion of Maltese and percentage of single mother households in the United States with a correlation coefficient (R) of -0.043 and weighted average of 5.2%. Similarly, the statistical analysis conducted on geographies consisting of 357,161,566 people shows a mild positive correlation between the proportion of Immigrants from Western Africa and percentage of single mother households in the United States with a correlation coefficient (R) of 0.325 and weighted average of 8.2%, a difference of 57.4%.
Maltese vs Immigrants from Western Africa Single Mother Households

Single Mother Households Correlation Summary

MeasurementMalteseImmigrants from Western Africa
Minimum1.4%1.8%
Maximum11.2%24.0%
Range9.8%22.2%
Mean4.2%10.2%
Median4.2%9.4%
Interquartile 25% (IQ1)3.3%7.9%
Interquartile 75% (IQ3)4.9%11.7%
Interquartile Range (IQR)1.7%3.8%
Standard Deviation (Sample)1.7%3.8%
Standard Deviation (Population)1.7%3.7%

Similar Demographics by Single Mother Households

Demographics Similar to Maltese by Single Mother Households

In terms of single mother households, the demographic groups most similar to Maltese are Eastern European (5.2%, a difference of 0.060%), Chinese (5.2%, a difference of 0.47%), Immigrants from Armenia (5.2%, a difference of 0.57%), Thai (5.2%, a difference of 0.78%), and Immigrants from Austria (5.2%, a difference of 0.83%).
DemographicsRating | RankSingle Mother Households
Immigrants | India
99.9
/100
|
#13
Exceptional
5.1%
Immigrants | Australia
99.9
/100
|
#14
Exceptional
5.1%
Immigrants | Eastern Asia
99.9
/100
|
#15
Exceptional
5.1%
Indians (Asian)
99.9
/100
|
#16
Exceptional
5.1%
Soviet Union
99.9
/100
|
#17
Exceptional
5.1%
Immigrants | Armenia
99.9
/100
|
#18
Exceptional
5.2%
Chinese
99.9
/100
|
#19
Exceptional
5.2%
Maltese
99.9
/100
|
#20
Exceptional
5.2%
Eastern Europeans
99.8
/100
|
#21
Exceptional
5.2%
Thais
99.8
/100
|
#22
Exceptional
5.2%
Immigrants | Austria
99.8
/100
|
#23
Exceptional
5.2%
Armenians
99.8
/100
|
#24
Exceptional
5.2%
Immigrants | Japan
99.8
/100
|
#25
Exceptional
5.2%
Immigrants | Lithuania
99.8
/100
|
#26
Exceptional
5.3%
Bhutanese
99.7
/100
|
#27
Exceptional
5.3%

Demographics Similar to Immigrants from Western Africa by Single Mother Households

In terms of single mother households, the demographic groups most similar to Immigrants from Western Africa are Immigrants from Mexico (8.2%, a difference of 0.030%), Immigrants from Grenada (8.2%, a difference of 0.15%), African (8.2%, a difference of 0.15%), Immigrants from Honduras (8.2%, a difference of 0.28%), and Bangladeshi (8.1%, a difference of 0.31%).
DemographicsRating | RankSingle Mother Households
Immigrants | Central America
0.0
/100
|
#308
Tragic
8.1%
Cheyenne
0.0
/100
|
#309
Tragic
8.1%
Hondurans
0.0
/100
|
#310
Tragic
8.1%
Immigrants | Congo
0.0
/100
|
#311
Tragic
8.1%
Bangladeshis
0.0
/100
|
#312
Tragic
8.1%
Immigrants | Grenada
0.0
/100
|
#313
Tragic
8.2%
Immigrants | Mexico
0.0
/100
|
#314
Tragic
8.2%
Immigrants | Western Africa
0.0
/100
|
#315
Tragic
8.2%
Africans
0.0
/100
|
#316
Tragic
8.2%
Immigrants | Honduras
0.0
/100
|
#317
Tragic
8.2%
Senegalese
0.0
/100
|
#318
Tragic
8.2%
Jamaicans
0.0
/100
|
#319
Tragic
8.2%
Bahamians
0.0
/100
|
#320
Tragic
8.3%
Immigrants | Senegal
0.0
/100
|
#321
Tragic
8.3%
Pima
0.0
/100
|
#322
Tragic
8.3%