Luxembourger vs Immigrants from Japan Single Father Households
COMPARE
Luxembourger
Immigrants from Japan
Single Father Households
Single Father Households Comparison
Luxembourgers
Immigrants from Japan
2.2%
SINGLE FATHER HOUSEHOLDS
92.3/ 100
METRIC RATING
142nd/ 347
METRIC RANK
2.0%
SINGLE FATHER HOUSEHOLDS
100.0/ 100
METRIC RATING
28th/ 347
METRIC RANK
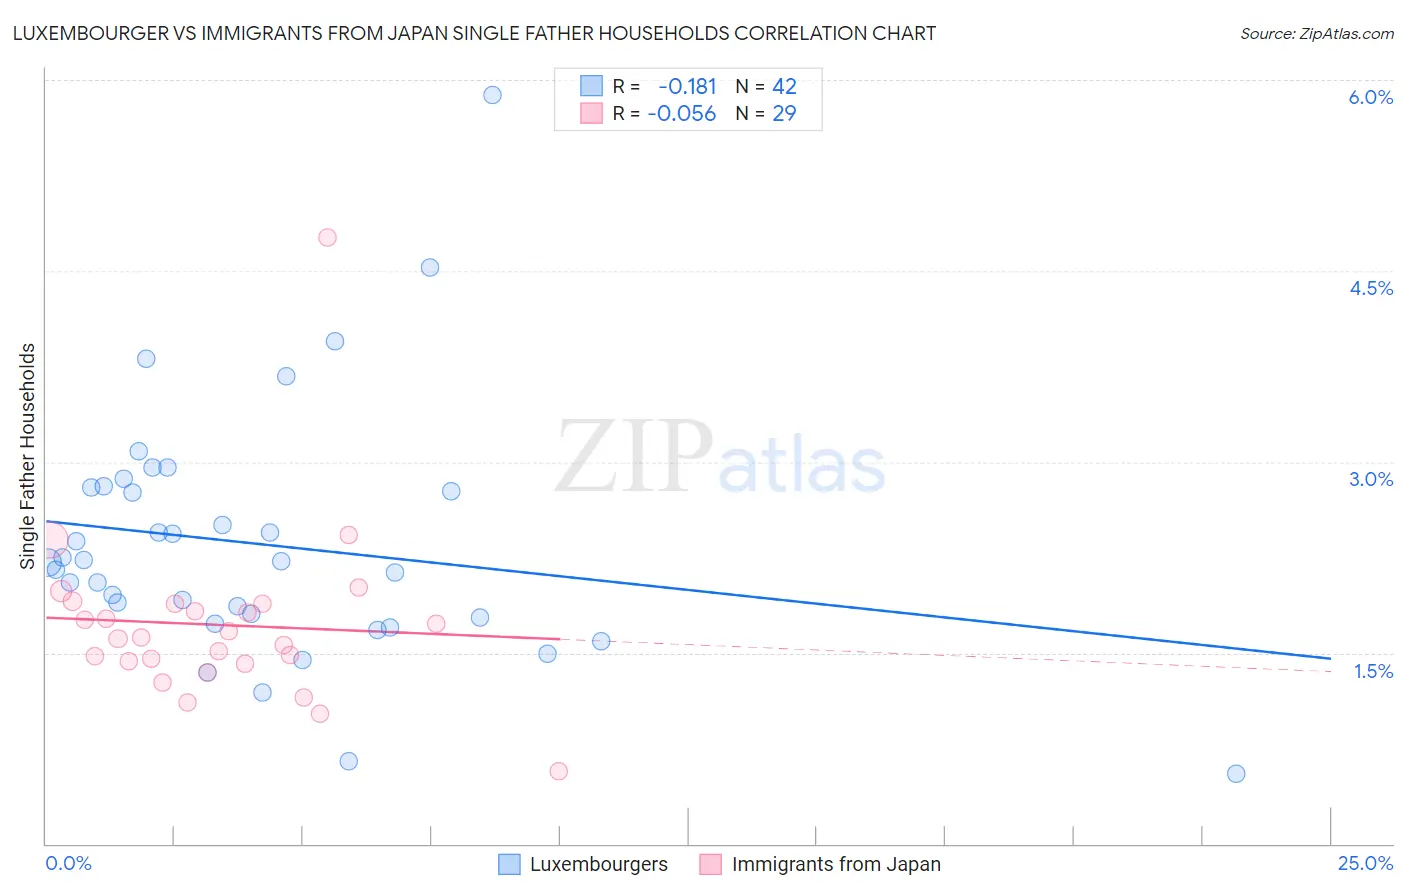
Luxembourger vs Immigrants from Japan Single Father Households Correlation Chart
The statistical analysis conducted on geographies consisting of 143,992,670 people shows a poor negative correlation between the proportion of Luxembourgers and percentage of single father households in the United States with a correlation coefficient (R) of -0.181 and weighted average of 2.2%. Similarly, the statistical analysis conducted on geographies consisting of 337,808,657 people shows a slight negative correlation between the proportion of Immigrants from Japan and percentage of single father households in the United States with a correlation coefficient (R) of -0.056 and weighted average of 2.0%, a difference of 13.3%.
Single Father Households Correlation Summary
| Measurement | Luxembourger | Immigrants from Japan |
| Minimum | 0.55% | 0.57% |
| Maximum | 5.9% | 4.8% |
| Range | 5.3% | 4.2% |
| Mean | 2.4% | 1.7% |
| Median | 2.2% | 1.6% |
| Interquartile 25% (IQ1) | 1.8% | 1.4% |
| Interquartile 75% (IQ3) | 2.8% | 1.9% |
| Interquartile Range (IQR) | 1.0% | 0.46% |
| Standard Deviation (Sample) | 0.98% | 0.70% |
| Standard Deviation (Population) | 0.97% | 0.69% |
Similar Demographics by Single Father Households
Demographics Similar to Luxembourgers by Single Father Households
In terms of single father households, the demographic groups most similar to Luxembourgers are Laotian (2.2%, a difference of 0.040%), Immigrants from Nepal (2.2%, a difference of 0.060%), Brazilian (2.2%, a difference of 0.13%), British (2.2%, a difference of 0.13%), and Slovak (2.2%, a difference of 0.40%).
| Demographics | Rating | Rank | Single Father Households |
| Syrians | 94.8 /100 | #135 | Exceptional 2.2% |
| Chileans | 94.5 /100 | #136 | Exceptional 2.2% |
| Austrians | 94.2 /100 | #137 | Exceptional 2.2% |
| West Indians | 94.1 /100 | #138 | Exceptional 2.2% |
| Brazilians | 92.8 /100 | #139 | Exceptional 2.2% |
| British | 92.8 /100 | #140 | Exceptional 2.2% |
| Laotians | 92.5 /100 | #141 | Exceptional 2.2% |
| Luxembourgers | 92.3 /100 | #142 | Exceptional 2.2% |
| Immigrants | Nepal | 92.1 /100 | #143 | Exceptional 2.2% |
| Slovaks | 90.7 /100 | #144 | Exceptional 2.2% |
| Immigrants | Zimbabwe | 90.2 /100 | #145 | Exceptional 2.2% |
| Northern Europeans | 89.8 /100 | #146 | Excellent 2.2% |
| Slavs | 88.9 /100 | #147 | Excellent 2.2% |
| South American Indians | 88.5 /100 | #148 | Excellent 2.3% |
| Senegalese | 88.4 /100 | #149 | Excellent 2.3% |
Demographics Similar to Immigrants from Japan by Single Father Households
In terms of single father households, the demographic groups most similar to Immigrants from Japan are Bulgarian (2.0%, a difference of 0.090%), Cambodian (2.0%, a difference of 0.11%), Israeli (2.0%, a difference of 0.14%), Immigrants from South Central Asia (2.0%, a difference of 0.18%), and Chinese (2.0%, a difference of 0.18%).
| Demographics | Rating | Rank | Single Father Households |
| Immigrants | Albania | 100.0 /100 | #21 | Exceptional 1.9% |
| Immigrants | Latvia | 100.0 /100 | #22 | Exceptional 1.9% |
| Immigrants | Croatia | 100.0 /100 | #23 | Exceptional 2.0% |
| Immigrants | Russia | 100.0 /100 | #24 | Exceptional 2.0% |
| Eastern Europeans | 100.0 /100 | #25 | Exceptional 2.0% |
| Assyrians/Chaldeans/Syriacs | 100.0 /100 | #26 | Exceptional 2.0% |
| Immigrants | South Central Asia | 100.0 /100 | #27 | Exceptional 2.0% |
| Immigrants | Japan | 100.0 /100 | #28 | Exceptional 2.0% |
| Bulgarians | 100.0 /100 | #29 | Exceptional 2.0% |
| Cambodians | 100.0 /100 | #30 | Exceptional 2.0% |
| Israelis | 100.0 /100 | #31 | Exceptional 2.0% |
| Chinese | 100.0 /100 | #32 | Exceptional 2.0% |
| Turks | 100.0 /100 | #33 | Exceptional 2.0% |
| Immigrants | Australia | 100.0 /100 | #34 | Exceptional 2.0% |
| Albanians | 100.0 /100 | #35 | Exceptional 2.0% |