Luxembourger vs Immigrants from Bolivia Family Households with Children

COMPARE

Luxembourger
Race
Ancestry
AfghanAfricanAlaska NativeAlaskan AthabascanAlbanianAleutAlsatianAmericanApacheArabArapahoArgentineanArmenianAssyrian/Chaldean/SyriacAustralianAustrianBahamianBangladeshiBarbadianBasqueBelgianBelizeanBermudanBhutaneseBlackfeetBolivianBrazilianBritishBritish West IndianBulgarianBurmeseCajunCambodianCanadianCape VerdeanCarpatho RusynCelticCentral AmericanCentral American IndianCherokeeCheyenneChickasawChileanChineseChippewaChoctawColombianColvilleComancheCosta RicanCreeCreekCroatianCrowCubanCypriotCzechCzechoslovakianDanishDelawareDominicanDutchDutch West IndianEastern EuropeanEcuadorianEgyptianEnglishEstonianEthiopianEuropeanFijianFilipinoFinnishFrenchFrench American IndianFrench CanadianGermanGerman RussianGhanaianGreekGuamanian/ChamorroGuatemalanGuyaneseHaitianHmongHonduranHopiHoumaHungarianIcelanderIndian (Asian)IndonesianInupiatIranianIraqiIrishIroquoisIsraeliItalianJamaicanJapaneseJordanianKenyanKiowaKoreanLaotianLatvianLebaneseLiberianLithuanianLumbeeLuxembourgerMacedonianMalaysianMalteseMarshalleseMenomineeMexicanMexican American IndianMongolianMoroccanNative HawaiianNavajoNepaleseNew ZealanderNicaraguanNigerianNorthern EuropeanNorwegianOkinawanOsageOttawaPaiutePakistaniPalestinianPanamanianParaguayanPennsylvania GermanPeruvianPimaPolishPortuguesePotawatomiPuebloPuerto RicanPuget Sound SalishRomanianRussianSalvadoranSamoanScandinavianScotch-IrishScottishSeminoleSenegaleseSerbianShoshoneSierra LeoneanSiouxSlavicSlovakSloveneSomaliSouth AfricanSouth AmericanSouth American IndianSoviet UnionSpaniardSpanishSpanish AmericanSpanish American IndianSri LankanSubsaharan AfricanSudaneseSwedishSwissSyrianTaiwaneseThaiTlingit-HaidaTohono O'OdhamTonganTrinidadian and TobagonianTsimshianTurkishU.S. Virgin IslanderUgandanUkrainianUruguayanUteVenezuelanVietnameseWelshWest IndianYakamaYaquiYugoslavianYumanYup'ikZimbabwean
Immigration
NonimmigrantsImmigrantsAfghanistanAfricaAlbaniaArgentinaArmeniaAsiaAustraliaAustriaBahamasBangladeshBarbadosBelarusBelgiumBelizeBosnia and HerzegovinaBrazilBulgariaBurma/MyanmarCabo VerdeCambodiaCameroonCanadaCaribbeanCentral AmericaChileChinaColombiaCongoCosta RicaCroatiaCubaCzechoslovakiaDenmarkDominicaDominican RepublicEastern AfricaEastern AsiaEastern EuropeEcuadorEgyptEl SalvadorEnglandEritreaEthiopiaEuropeFijiFranceGermanyGhanaGreeceGrenadaGuatemalaGuyanaHaitiHondurasHong KongHungaryIndiaIndonesiaIranIraqIrelandIsraelItalyJamaicaJapanJordanKazakhstanKenyaKoreaKuwaitLaosLatin AmericaLatviaLebanonLiberiaLithuaniaMalaysiaMexicoMicronesiaMiddle AfricaMoldovaMoroccoNepalNetherlandsNicaraguaNigeriaNorth AmericaNorth MacedoniaNorthern AfricaNorthern EuropeNorwayOceaniaPakistanPanamaPeruPhilippinesPolandPortugalRomaniaRussiaSaudi ArabiaScotlandSenegalSerbiaSierra LeoneSingaporeSomaliaSouth AfricaSouth AmericaSouth Central AsiaSouth Eastern AsiaSouthern EuropeSpainSri LankaSt. Vincent and the GrenadinesSudanSwedenSwitzerlandSyriaTaiwanThailandTrinidad and TobagoTurkeyUgandaUkraineUruguayUzbekistanVenezuelaVietnamWest IndiesWestern AfricaWestern AsiaWestern EuropeYemenZaireZimbabweAzores
Immigrants from Bolivia
Race
Ancestry
AfghanAfricanAlaska NativeAlaskan AthabascanAlbanianAleutAlsatianAmericanApacheArabArapahoArgentineanArmenianAssyrian/Chaldean/SyriacAustralianAustrianBahamianBangladeshiBarbadianBasqueBelgianBelizeanBermudanBhutaneseBlackfeetBolivianBrazilianBritishBritish West IndianBulgarianBurmeseCajunCambodianCanadianCape VerdeanCarpatho RusynCelticCentral AmericanCentral American IndianCherokeeCheyenneChickasawChileanChineseChippewaChoctawColombianColvilleComancheCosta RicanCreeCreekCroatianCrowCubanCypriotCzechCzechoslovakianDanishDelawareDominicanDutchDutch West IndianEastern EuropeanEcuadorianEgyptianEnglishEstonianEthiopianEuropeanFijianFilipinoFinnishFrenchFrench American IndianFrench CanadianGermanGerman RussianGhanaianGreekGuamanian/ChamorroGuatemalanGuyaneseHaitianHmongHonduranHopiHoumaHungarianIcelanderIndian (Asian)IndonesianInupiatIranianIraqiIrishIroquoisIsraeliItalianJamaicanJapaneseJordanianKenyanKiowaKoreanLaotianLatvianLebaneseLiberianLithuanianLumbeeMacedonianMalaysianMalteseMarshalleseMenomineeMexicanMexican American IndianMongolianMoroccanNative HawaiianNavajoNepaleseNew ZealanderNicaraguanNigerianNorthern EuropeanNorwegianOkinawanOsageOttawaPaiutePakistaniPalestinianPanamanianParaguayanPennsylvania GermanPeruvianPimaPolishPortuguesePotawatomiPuebloPuerto RicanPuget Sound SalishRomanianRussianSalvadoranSamoanScandinavianScotch-IrishScottishSeminoleSenegaleseSerbianShoshoneSierra LeoneanSiouxSlavicSlovakSloveneSomaliSouth AfricanSouth AmericanSouth American IndianSoviet UnionSpaniardSpanishSpanish AmericanSpanish American IndianSri LankanSubsaharan AfricanSudaneseSwedishSwissSyrianTaiwaneseThaiTlingit-HaidaTohono O'OdhamTonganTrinidadian and TobagonianTsimshianTurkishU.S. Virgin IslanderUgandanUkrainianUruguayanUteVenezuelanVietnameseWelshWest IndianYakamaYaquiYugoslavianYumanYup'ikZimbabwean
Immigration
NonimmigrantsImmigrantsAfghanistanAfricaAlbaniaArgentinaArmeniaAsiaAustraliaAustriaBahamasBangladeshBarbadosBelarusBelgiumBelizeBoliviaBosnia and HerzegovinaBrazilBulgariaBurma/MyanmarCabo VerdeCambodiaCameroonCanadaCaribbeanCentral AmericaChileChinaColombiaCongoCosta RicaCroatiaCubaCzechoslovakiaDenmarkDominicaDominican RepublicEastern AfricaEastern AsiaEastern EuropeEcuadorEgyptEl SalvadorEnglandEritreaEthiopiaEuropeFijiFranceGermanyGhanaGreeceGrenadaGuatemalaGuyanaHaitiHondurasHong KongHungaryIndiaIndonesiaIranIraqIrelandIsraelItalyJamaicaJapanJordanKazakhstanKenyaKoreaKuwaitLaosLatin AmericaLatviaLebanonLiberiaLithuaniaMalaysiaMexicoMicronesiaMiddle AfricaMoldovaMoroccoNepalNetherlandsNicaraguaNigeriaNorth AmericaNorth MacedoniaNorthern AfricaNorthern EuropeNorwayOceaniaPakistanPanamaPeruPhilippinesPolandPortugalRomaniaRussiaSaudi ArabiaScotlandSenegalSerbiaSierra LeoneSingaporeSomaliaSouth AfricaSouth AmericaSouth Central AsiaSouth Eastern AsiaSouthern EuropeSpainSri LankaSt. Vincent and the GrenadinesSudanSwedenSwitzerlandSyriaTaiwanThailandTrinidad and TobagoTurkeyUgandaUkraineUruguayUzbekistanVenezuelaVietnamWest IndiesWestern AfricaWestern AsiaWestern EuropeYemenZaireZimbabweAzores
Family Households with Children
Income
Poverty
Unemployment
Labor Participation
Family Structure
Vehicle Availability
Education Level
Disability

Family Households with Children Comparison

Luxembourgers

Immigrants from Bolivia

Tragic
Exceptional
27.0%
FAMILY HOUSEHOLDS WITH CHILDREN
5.5/ 100
METRIC RATING
231st/ 347
METRIC RANK
29.3%
FAMILY HOUSEHOLDS WITH CHILDREN
100.0/ 100
METRIC RATING
34th/ 347
METRIC RANK

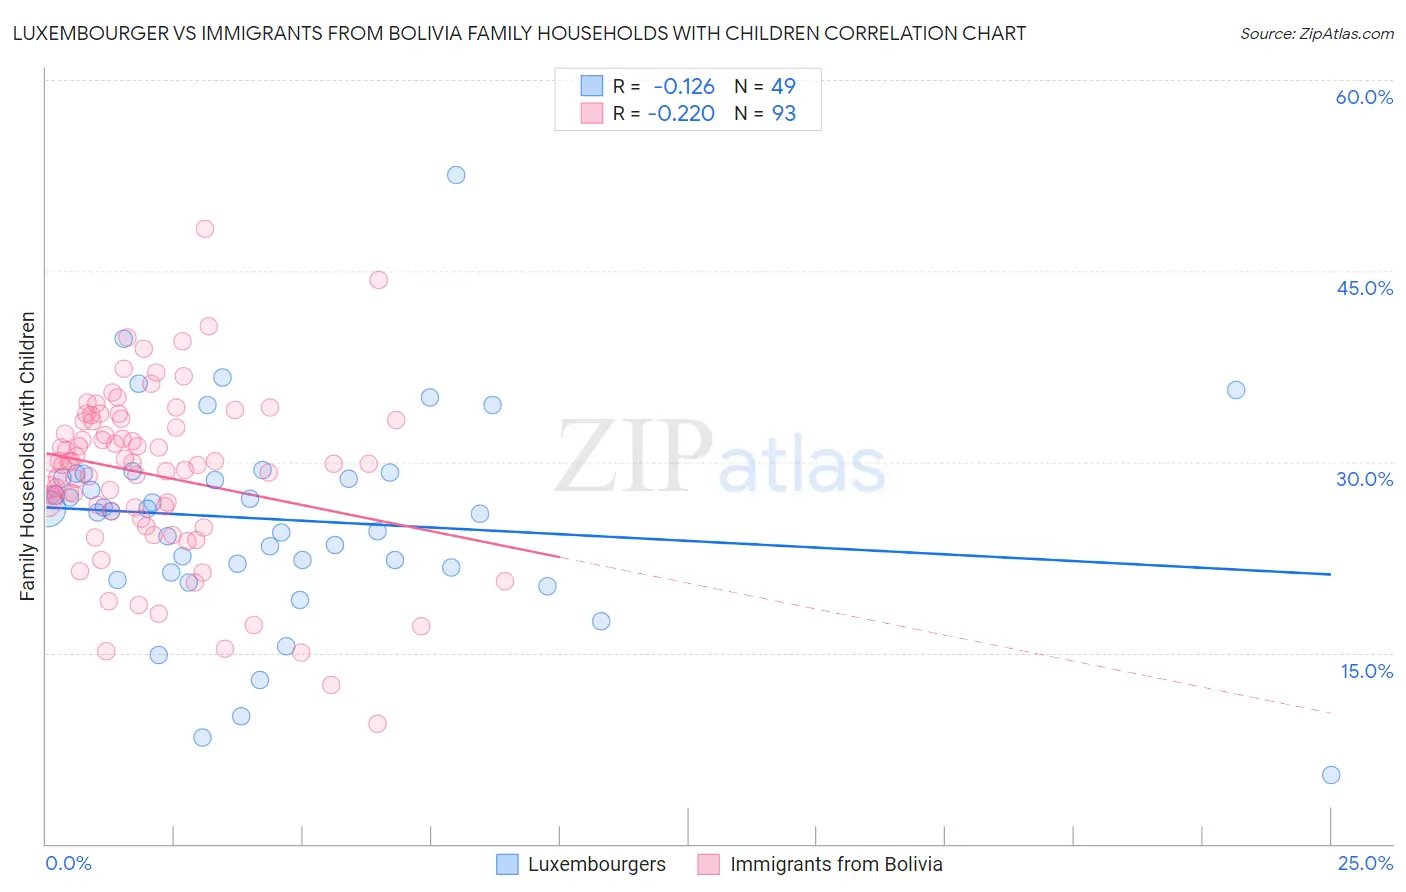
Luxembourger vs Immigrants from Bolivia Family Households with Children Correlation Chart

The statistical analysis conducted on geographies consisting of 144,627,204 people shows a poor negative correlation between the proportion of Luxembourgers and percentage of family households with children in the United States with a correlation coefficient (R) of -0.126 and weighted average of 27.0%. Similarly, the statistical analysis conducted on geographies consisting of 158,666,427 people shows a weak negative correlation between the proportion of Immigrants from Bolivia and percentage of family households with children in the United States with a correlation coefficient (R) of -0.220 and weighted average of 29.3%, a difference of 8.6%.
Luxembourger vs Immigrants from Bolivia Family Households with Children

Family Households with Children Correlation Summary

MeasurementLuxembourgerImmigrants from Bolivia
Minimum5.4%9.4%
Maximum52.5%48.4%
Range47.1%39.0%
Mean25.5%29.0%
Median26.1%29.9%
Interquartile 25% (IQ1)21.5%25.8%
Interquartile 75% (IQ3)29.1%33.3%
Interquartile Range (IQR)7.6%7.4%
Standard Deviation (Sample)8.2%6.7%
Standard Deviation (Population)8.1%6.7%

Similar Demographics by Family Households with Children

Demographics Similar to Luxembourgers by Family Households with Children

In terms of family households with children, the demographic groups most similar to Luxembourgers are Bulgarian (27.0%, a difference of 0.030%), Yugoslavian (27.0%, a difference of 0.050%), Immigrants from Italy (27.0%, a difference of 0.050%), Immigrants from Caribbean (27.0%, a difference of 0.080%), and Scottish (27.0%, a difference of 0.10%).
DemographicsRating | RankFamily Households with Children
Germans
8.7
/100
|
#224
Tragic
27.1%
Canadians
7.5
/100
|
#225
Tragic
27.1%
Czechoslovakians
6.6
/100
|
#226
Tragic
27.0%
Tsimshian
6.6
/100
|
#227
Tragic
27.0%
Scottish
6.5
/100
|
#228
Tragic
27.0%
Immigrants | Caribbean
6.3
/100
|
#229
Tragic
27.0%
Bulgarians
5.8
/100
|
#230
Tragic
27.0%
Luxembourgers
5.5
/100
|
#231
Tragic
27.0%
Yugoslavians
5.1
/100
|
#232
Tragic
27.0%
Immigrants | Italy
5.0
/100
|
#233
Tragic
27.0%
Immigrants | Germany
4.4
/100
|
#234
Tragic
27.0%
Immigrants | Morocco
4.2
/100
|
#235
Tragic
27.0%
Cape Verdeans
3.6
/100
|
#236
Tragic
26.9%
Immigrants | Netherlands
3.5
/100
|
#237
Tragic
26.9%
Moroccans
3.4
/100
|
#238
Tragic
26.9%

Demographics Similar to Immigrants from Bolivia by Family Households with Children

In terms of family households with children, the demographic groups most similar to Immigrants from Bolivia are Venezuelan (29.4%, a difference of 0.060%), Immigrants from Sierra Leone (29.3%, a difference of 0.16%), Immigrants from Venezuela (29.3%, a difference of 0.17%), Immigrants from Yemen (29.4%, a difference of 0.25%), and Japanese (29.4%, a difference of 0.31%).
DemographicsRating | RankFamily Households with Children
Immigrants | Vietnam
100.0
/100
|
#27
Exceptional
29.5%
Samoans
100.0
/100
|
#28
Exceptional
29.5%
Bolivians
100.0
/100
|
#29
Exceptional
29.5%
Yuman
100.0
/100
|
#30
Exceptional
29.5%
Japanese
100.0
/100
|
#31
Exceptional
29.4%
Immigrants | Yemen
100.0
/100
|
#32
Exceptional
29.4%
Venezuelans
100.0
/100
|
#33
Exceptional
29.4%
Immigrants | Bolivia
100.0
/100
|
#34
Exceptional
29.3%
Immigrants | Sierra Leone
100.0
/100
|
#35
Exceptional
29.3%
Immigrants | Venezuela
100.0
/100
|
#36
Exceptional
29.3%
Immigrants | Cameroon
100.0
/100
|
#37
Exceptional
29.2%
Koreans
100.0
/100
|
#38
Exceptional
29.2%
Yaqui
100.0
/100
|
#39
Exceptional
29.1%
Central Americans
100.0
/100
|
#40
Exceptional
29.1%
Immigrants | South Eastern Asia
100.0
/100
|
#41
Exceptional
29.1%