Liberian vs Filipino Single Father Households
COMPARE
Liberian
Filipino
Single Father Households
Single Father Households Comparison
Liberians
Filipinos
2.5%
SINGLE FATHER HOUSEHOLDS
2.0/ 100
METRIC RATING
251st/ 347
METRIC RANK
1.8%
SINGLE FATHER HOUSEHOLDS
100.0/ 100
METRIC RATING
3rd/ 347
METRIC RANK
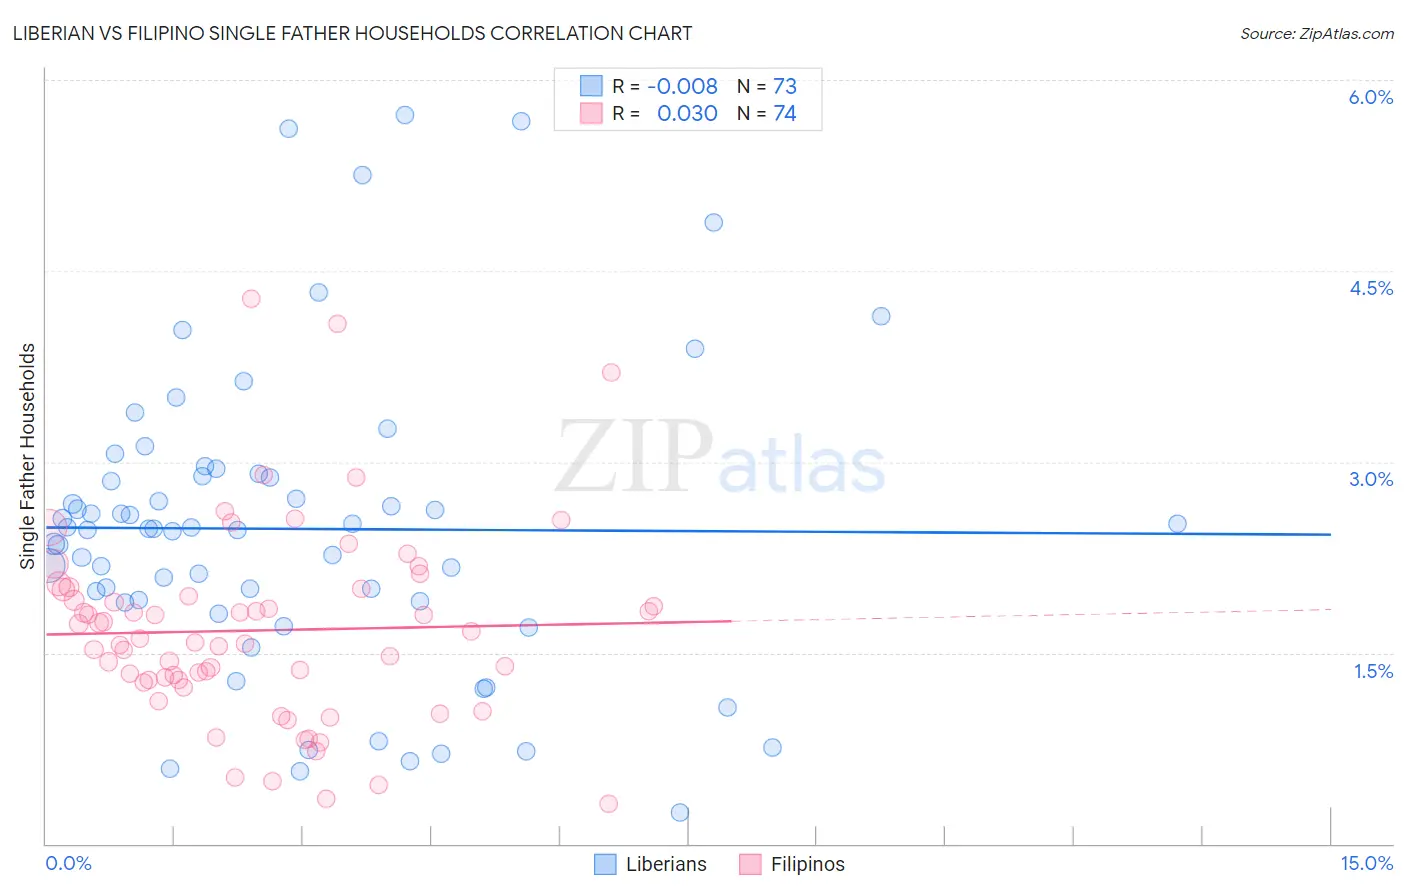
Liberian vs Filipino Single Father Households Correlation Chart
The statistical analysis conducted on geographies consisting of 117,831,420 people shows no correlation between the proportion of Liberians and percentage of single father households in the United States with a correlation coefficient (R) of -0.008 and weighted average of 2.5%. Similarly, the statistical analysis conducted on geographies consisting of 252,994,105 people shows no correlation between the proportion of Filipinos and percentage of single father households in the United States with a correlation coefficient (R) of 0.030 and weighted average of 1.8%, a difference of 39.0%.
Single Father Households Correlation Summary
| Measurement | Liberian | Filipino |
| Minimum | 0.24% | 0.31% |
| Maximum | 5.7% | 4.3% |
| Range | 5.5% | 4.0% |
| Mean | 2.5% | 1.7% |
| Median | 2.5% | 1.6% |
| Interquartile 25% (IQ1) | 1.9% | 1.3% |
| Interquartile 75% (IQ3) | 2.9% | 2.0% |
| Interquartile Range (IQR) | 0.99% | 0.72% |
| Standard Deviation (Sample) | 1.2% | 0.76% |
| Standard Deviation (Population) | 1.2% | 0.75% |
Similar Demographics by Single Father Households
Demographics Similar to Liberians by Single Father Households
In terms of single father households, the demographic groups most similar to Liberians are Immigrants from Eritrea (2.5%, a difference of 0.020%), Somali (2.5%, a difference of 0.090%), Immigrants from Somalia (2.5%, a difference of 0.090%), Immigrants from Thailand (2.5%, a difference of 0.13%), and Immigrants from Cameroon (2.5%, a difference of 0.26%).
| Demographics | Rating | Rank | Single Father Households |
| Immigrants | Middle Africa | 2.8 /100 | #244 | Tragic 2.5% |
| Basques | 2.5 /100 | #245 | Tragic 2.5% |
| Native Hawaiians | 2.5 /100 | #246 | Tragic 2.5% |
| Delaware | 2.5 /100 | #247 | Tragic 2.5% |
| Bahamians | 2.4 /100 | #248 | Tragic 2.5% |
| Immigrants | Cameroon | 2.3 /100 | #249 | Tragic 2.5% |
| Somalis | 2.1 /100 | #250 | Tragic 2.5% |
| Liberians | 2.0 /100 | #251 | Tragic 2.5% |
| Immigrants | Eritrea | 2.0 /100 | #252 | Tragic 2.5% |
| Immigrants | Somalia | 1.9 /100 | #253 | Tragic 2.5% |
| Immigrants | Thailand | 1.8 /100 | #254 | Tragic 2.5% |
| Tongans | 1.5 /100 | #255 | Tragic 2.5% |
| Potawatomi | 1.4 /100 | #256 | Tragic 2.5% |
| Immigrants | Congo | 1.2 /100 | #257 | Tragic 2.5% |
| Spanish | 1.1 /100 | #258 | Tragic 2.5% |
Demographics Similar to Filipinos by Single Father Households
In terms of single father households, the demographic groups most similar to Filipinos are Immigrants from Israel (1.8%, a difference of 0.42%), Soviet Union (1.8%, a difference of 0.46%), Immigrants from Uzbekistan (1.8%, a difference of 0.66%), Immigrants from Hong Kong (1.8%, a difference of 1.6%), and Immigrants from Taiwan (1.8%, a difference of 2.0%).
| Demographics | Rating | Rank | Single Father Households |
| Soviet Union | 100.0 /100 | #1 | Exceptional 1.8% |
| Immigrants | Israel | 100.0 /100 | #2 | Exceptional 1.8% |
| Filipinos | 100.0 /100 | #3 | Exceptional 1.8% |
| Immigrants | Uzbekistan | 100.0 /100 | #4 | Exceptional 1.8% |
| Immigrants | Hong Kong | 100.0 /100 | #5 | Exceptional 1.8% |
| Immigrants | Taiwan | 100.0 /100 | #6 | Exceptional 1.8% |
| Cypriots | 100.0 /100 | #7 | Exceptional 1.8% |
| Immigrants | Ireland | 100.0 /100 | #8 | Exceptional 1.8% |
| Immigrants | China | 100.0 /100 | #9 | Exceptional 1.8% |
| Okinawans | 100.0 /100 | #10 | Exceptional 1.9% |
| Immigrants | Belarus | 100.0 /100 | #11 | Exceptional 1.9% |
| Immigrants | Greece | 100.0 /100 | #12 | Exceptional 1.9% |
| Immigrants | Singapore | 100.0 /100 | #13 | Exceptional 1.9% |
| Immigrants | Lithuania | 100.0 /100 | #14 | Exceptional 1.9% |
| Immigrants | Eastern Asia | 100.0 /100 | #15 | Exceptional 1.9% |