Latvian vs Comanche Divorced or Separated

COMPARE

Latvian
Race
Ancestry
AfghanAfricanAlaska NativeAlaskan AthabascanAlbanianAleutAlsatianAmericanApacheArabArapahoArgentineanArmenianAssyrian/Chaldean/SyriacAustralianAustrianBahamianBangladeshiBarbadianBasqueBelgianBelizeanBermudanBhutaneseBlackfeetBolivianBrazilianBritishBritish West IndianBulgarianBurmeseCajunCambodianCanadianCape VerdeanCarpatho RusynCelticCentral AmericanCentral American IndianCherokeeCheyenneChickasawChileanChineseChippewaChoctawColombianColvilleCosta RicanCreeCreekCroatianCrowCubanCypriotCzechCzechoslovakianDanishDelawareDominicanDutchDutch West IndianEastern EuropeanEcuadorianEgyptianEnglishEstonianEthiopianEuropeanFijianFilipinoFinnishFrenchFrench American IndianFrench CanadianGermanGerman RussianGhanaianGreekGuamanian/ChamorroGuatemalanGuyaneseHaitianHmongHonduranHopiHoumaHungarianIcelanderIndian (Asian)IndonesianInupiatIranianIraqiIrishIroquoisIsraeliItalianJamaicanJapaneseJordanianKenyanKiowaKoreanLaotianLatvianLebaneseLiberianLithuanianLumbeeLuxembourgerMacedonianMalaysianMalteseMarshalleseMenomineeMexicanMexican American IndianMongolianMoroccanNative HawaiianNavajoNepaleseNew ZealanderNicaraguanNigerianNorthern EuropeanNorwegianOkinawanOsageOttawaPaiutePakistaniPalestinianPanamanianParaguayanPennsylvania GermanPeruvianPimaPolishPortuguesePotawatomiPuebloPuerto RicanPuget Sound SalishRomanianRussianSalvadoranSamoanScandinavianScotch-IrishScottishSeminoleSenegaleseSerbianShoshoneSierra LeoneanSiouxSlavicSlovakSloveneSomaliSouth AfricanSouth AmericanSouth American IndianSoviet UnionSpaniardSpanishSpanish AmericanSpanish American IndianSri LankanSubsaharan AfricanSudaneseSwedishSwissSyrianTaiwaneseThaiTlingit-HaidaTohono O'OdhamTonganTrinidadian and TobagonianTsimshianTurkishU.S. Virgin IslanderUgandanUkrainianUruguayanUteVenezuelanVietnameseWelshWest IndianYakamaYaquiYugoslavianYumanYup'ikZimbabwean
Immigration
NonimmigrantsImmigrantsAfghanistanAfricaAlbaniaArgentinaArmeniaAsiaAustraliaAustriaBahamasBangladeshBarbadosBelarusBelgiumBelizeBoliviaBosnia and HerzegovinaBrazilBulgariaBurma/MyanmarCabo VerdeCambodiaCameroonCanadaCaribbeanCentral AmericaChileChinaColombiaCongoCosta RicaCroatiaCubaCzechoslovakiaDenmarkDominicaDominican RepublicEastern AfricaEastern AsiaEastern EuropeEcuadorEgyptEl SalvadorEnglandEritreaEthiopiaEuropeFijiFranceGermanyGhanaGreeceGrenadaGuatemalaGuyanaHaitiHondurasHong KongHungaryIndiaIndonesiaIranIraqIrelandIsraelItalyJamaicaJapanJordanKazakhstanKenyaKoreaKuwaitLaosLatin AmericaLatviaLebanonLiberiaLithuaniaMalaysiaMexicoMicronesiaMiddle AfricaMoldovaMoroccoNepalNetherlandsNicaraguaNigeriaNorth AmericaNorth MacedoniaNorthern AfricaNorthern EuropeNorwayOceaniaPakistanPanamaPeruPhilippinesPolandPortugalRomaniaRussiaSaudi ArabiaScotlandSenegalSerbiaSierra LeoneSingaporeSomaliaSouth AfricaSouth AmericaSouth Central AsiaSouth Eastern AsiaSouthern EuropeSpainSri LankaSt. Vincent and the GrenadinesSudanSwedenSwitzerlandSyriaTaiwanThailandTrinidad and TobagoTurkeyUgandaUkraineUruguayUzbekistanVenezuelaVietnamWest IndiesWestern AfricaWestern AsiaWestern EuropeYemenZaireZimbabweAzores
Comanche
Race
Ancestry
AfghanAfricanAlaska NativeAlaskan AthabascanAlbanianAleutAlsatianAmericanApacheArabArapahoArgentineanArmenianAssyrian/Chaldean/SyriacAustralianAustrianBahamianBangladeshiBarbadianBasqueBelgianBelizeanBermudanBhutaneseBlackfeetBolivianBrazilianBritishBritish West IndianBulgarianBurmeseCajunCambodianCanadianCape VerdeanCarpatho RusynCelticCentral AmericanCentral American IndianCherokeeCheyenneChickasawChileanChineseChippewaChoctawColombianColvilleComancheCosta RicanCreeCreekCroatianCrowCubanCypriotCzechCzechoslovakianDanishDelawareDominicanDutchDutch West IndianEastern EuropeanEcuadorianEgyptianEnglishEstonianEthiopianEuropeanFijianFilipinoFinnishFrenchFrench American IndianFrench CanadianGermanGerman RussianGhanaianGreekGuamanian/ChamorroGuatemalanGuyaneseHaitianHmongHonduranHopiHoumaHungarianIcelanderIndian (Asian)IndonesianInupiatIranianIraqiIrishIroquoisIsraeliItalianJamaicanJapaneseJordanianKenyanKiowaKoreanLaotianLebaneseLiberianLithuanianLumbeeLuxembourgerMacedonianMalaysianMalteseMarshalleseMenomineeMexicanMexican American IndianMongolianMoroccanNative HawaiianNavajoNepaleseNew ZealanderNicaraguanNigerianNorthern EuropeanNorwegianOkinawanOsageOttawaPaiutePakistaniPalestinianPanamanianParaguayanPennsylvania GermanPeruvianPimaPolishPortuguesePotawatomiPuebloPuerto RicanPuget Sound SalishRomanianRussianSalvadoranSamoanScandinavianScotch-IrishScottishSeminoleSenegaleseSerbianShoshoneSierra LeoneanSiouxSlavicSlovakSloveneSomaliSouth AfricanSouth AmericanSouth American IndianSoviet UnionSpaniardSpanishSpanish AmericanSpanish American IndianSri LankanSubsaharan AfricanSudaneseSwedishSwissSyrianTaiwaneseThaiTlingit-HaidaTohono O'OdhamTonganTrinidadian and TobagonianTsimshianTurkishU.S. Virgin IslanderUgandanUkrainianUruguayanUteVenezuelanVietnameseWelshWest IndianYakamaYaquiYugoslavianYumanYup'ikZimbabwean
Immigration
NonimmigrantsImmigrantsAfghanistanAfricaAlbaniaArgentinaArmeniaAsiaAustraliaAustriaBahamasBangladeshBarbadosBelarusBelgiumBelizeBoliviaBosnia and HerzegovinaBrazilBulgariaBurma/MyanmarCabo VerdeCambodiaCameroonCanadaCaribbeanCentral AmericaChileChinaColombiaCongoCosta RicaCroatiaCubaCzechoslovakiaDenmarkDominicaDominican RepublicEastern AfricaEastern AsiaEastern EuropeEcuadorEgyptEl SalvadorEnglandEritreaEthiopiaEuropeFijiFranceGermanyGhanaGreeceGrenadaGuatemalaGuyanaHaitiHondurasHong KongHungaryIndiaIndonesiaIranIraqIrelandIsraelItalyJamaicaJapanJordanKazakhstanKenyaKoreaKuwaitLaosLatin AmericaLatviaLebanonLiberiaLithuaniaMalaysiaMexicoMicronesiaMiddle AfricaMoldovaMoroccoNepalNetherlandsNicaraguaNigeriaNorth AmericaNorth MacedoniaNorthern AfricaNorthern EuropeNorwayOceaniaPakistanPanamaPeruPhilippinesPolandPortugalRomaniaRussiaSaudi ArabiaScotlandSenegalSerbiaSierra LeoneSingaporeSomaliaSouth AfricaSouth AmericaSouth Central AsiaSouth Eastern AsiaSouthern EuropeSpainSri LankaSt. Vincent and the GrenadinesSudanSwedenSwitzerlandSyriaTaiwanThailandTrinidad and TobagoTurkeyUgandaUkraineUruguayUzbekistanVenezuelaVietnamWest IndiesWestern AfricaWestern AsiaWestern EuropeYemenZaireZimbabweAzores
Divorced or Separated
Income
Poverty
Unemployment
Labor Participation
Family Structure
Vehicle Availability
Education Level
Disability

Divorced or Separated Comparison

Latvians

Comanche

Exceptional
Tragic
11.6%
DIVORCED OR SEPARATED
98.7/ 100
METRIC RATING
97th/ 347
METRIC RANK
13.5%
DIVORCED OR SEPARATED
0.0/ 100
METRIC RATING
327th/ 347
METRIC RANK

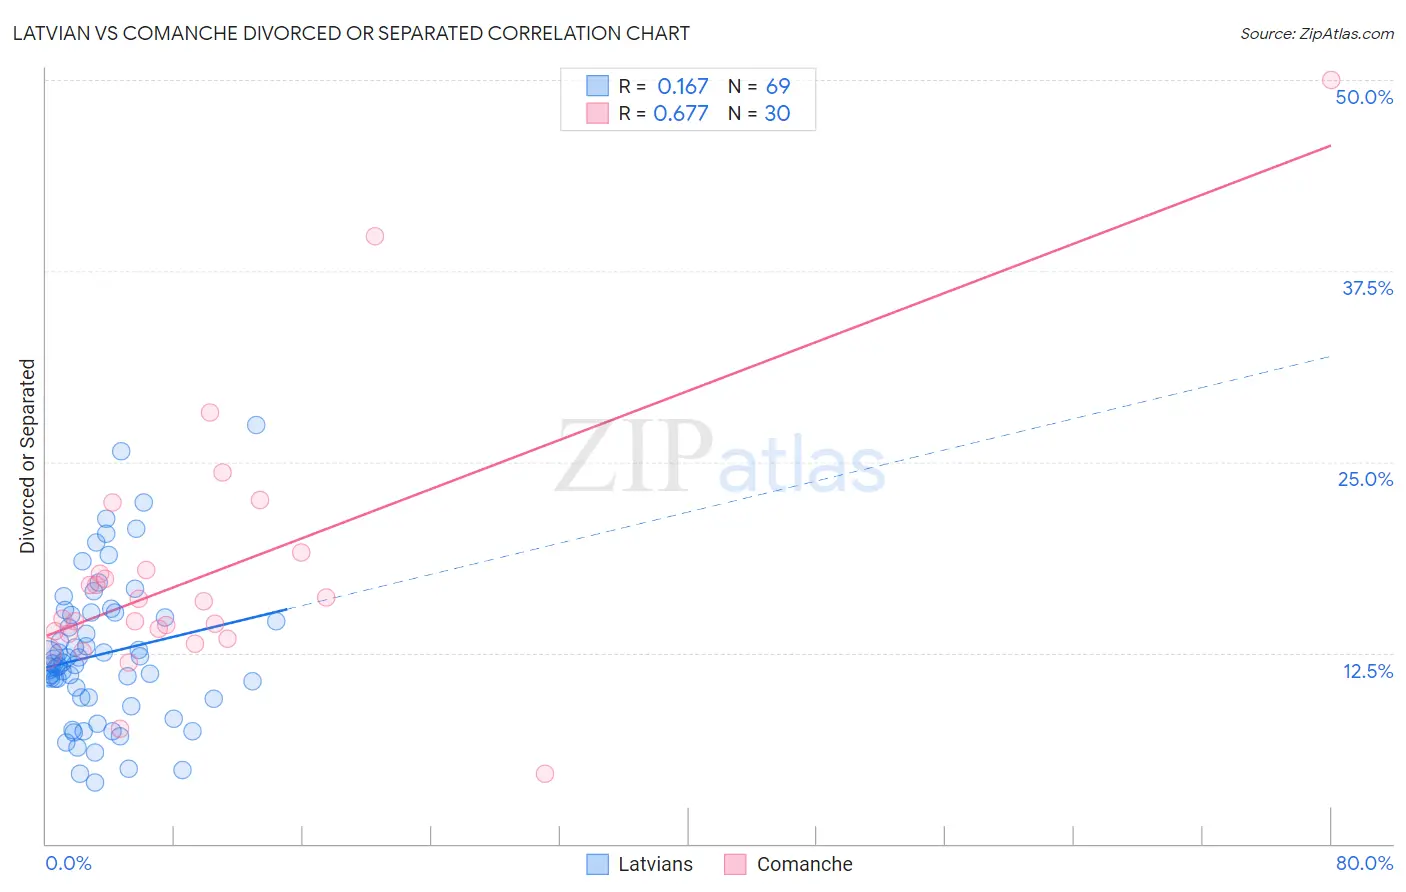
Latvian vs Comanche Divorced or Separated Correlation Chart

The statistical analysis conducted on geographies consisting of 220,642,308 people shows a poor positive correlation between the proportion of Latvians and percentage of population currently divorced or separated in the United States with a correlation coefficient (R) of 0.167 and weighted average of 11.6%. Similarly, the statistical analysis conducted on geographies consisting of 109,776,107 people shows a significant positive correlation between the proportion of Comanche and percentage of population currently divorced or separated in the United States with a correlation coefficient (R) of 0.677 and weighted average of 13.5%, a difference of 16.6%.
Latvian vs Comanche Divorced or Separated

Divorced or Separated Correlation Summary

MeasurementLatvianComanche
Minimum4.0%4.6%
Maximum27.4%50.0%
Range23.4%45.4%
Mean12.4%17.7%
Median11.8%15.3%
Interquartile 25% (IQ1)9.5%13.7%
Interquartile 75% (IQ3)15.0%18.0%
Interquartile Range (IQR)5.5%4.2%
Standard Deviation (Sample)4.8%8.8%
Standard Deviation (Population)4.8%8.6%

Similar Demographics by Divorced or Separated

Demographics Similar to Latvians by Divorced or Separated

In terms of divorced or separated, the demographic groups most similar to Latvians are Immigrants from Ukraine (11.6%, a difference of 0.030%), Immigrants from Jordan (11.6%, a difference of 0.040%), Immigrants from Serbia (11.6%, a difference of 0.050%), Immigrants from Sweden (11.6%, a difference of 0.060%), and Immigrants from Northern Europe (11.6%, a difference of 0.090%).
DemographicsRating | RankDivorced or Separated
Zimbabweans
99.0
/100
|
#90
Exceptional
11.6%
Spanish American Indians
99.0
/100
|
#91
Exceptional
11.6%
Immigrants | Denmark
98.9
/100
|
#92
Exceptional
11.6%
Arabs
98.9
/100
|
#93
Exceptional
11.6%
Immigrants | Fiji
98.9
/100
|
#94
Exceptional
11.6%
Immigrants | Serbia
98.8
/100
|
#95
Exceptional
11.6%
Immigrants | Ukraine
98.7
/100
|
#96
Exceptional
11.6%
Latvians
98.7
/100
|
#97
Exceptional
11.6%
Immigrants | Jordan
98.6
/100
|
#98
Exceptional
11.6%
Immigrants | Sweden
98.6
/100
|
#99
Exceptional
11.6%
Immigrants | Northern Europe
98.6
/100
|
#100
Exceptional
11.6%
Immigrants | Guyana
98.5
/100
|
#101
Exceptional
11.6%
Immigrants | Croatia
98.3
/100
|
#102
Exceptional
11.6%
Maltese
98.2
/100
|
#103
Exceptional
11.6%
Salvadorans
98.2
/100
|
#104
Exceptional
11.6%

Demographics Similar to Comanche by Divorced or Separated

In terms of divorced or separated, the demographic groups most similar to Comanche are Immigrants from Caribbean (13.6%, a difference of 0.38%), Immigrants from Congo (13.5%, a difference of 0.48%), Potawatomi (13.5%, a difference of 0.49%), Houma (13.6%, a difference of 0.53%), and Osage (13.4%, a difference of 0.55%).
DemographicsRating | RankDivorced or Separated
Cajuns
0.0
/100
|
#320
Tragic
13.4%
Cheyenne
0.0
/100
|
#321
Tragic
13.4%
Immigrants | Haiti
0.0
/100
|
#322
Tragic
13.4%
U.S. Virgin Islanders
0.0
/100
|
#323
Tragic
13.4%
Osage
0.0
/100
|
#324
Tragic
13.4%
Potawatomi
0.0
/100
|
#325
Tragic
13.5%
Immigrants | Congo
0.0
/100
|
#326
Tragic
13.5%
Comanche
0.0
/100
|
#327
Tragic
13.5%
Immigrants | Caribbean
0.0
/100
|
#328
Tragic
13.6%
Houma
0.0
/100
|
#329
Tragic
13.6%
Paiute
0.0
/100
|
#330
Tragic
13.6%
Blacks/African Americans
0.0
/100
|
#331
Tragic
13.6%
Cherokee
0.0
/100
|
#332
Tragic
13.7%
Puerto Ricans
0.0
/100
|
#333
Tragic
13.9%
Immigrants | Bahamas
0.0
/100
|
#334
Tragic
13.9%