Jordanian vs Spanish American Indian Family Households
COMPARE
Jordanian
Spanish American Indian
Family Households
Family Households Comparison
Jordanians
Spanish American Indians
65.5%
FAMILY HOUSEHOLDS
99.7/ 100
METRIC RATING
81st/ 347
METRIC RANK
71.2%
FAMILY HOUSEHOLDS
100.0/ 100
METRIC RATING
2nd/ 347
METRIC RANK
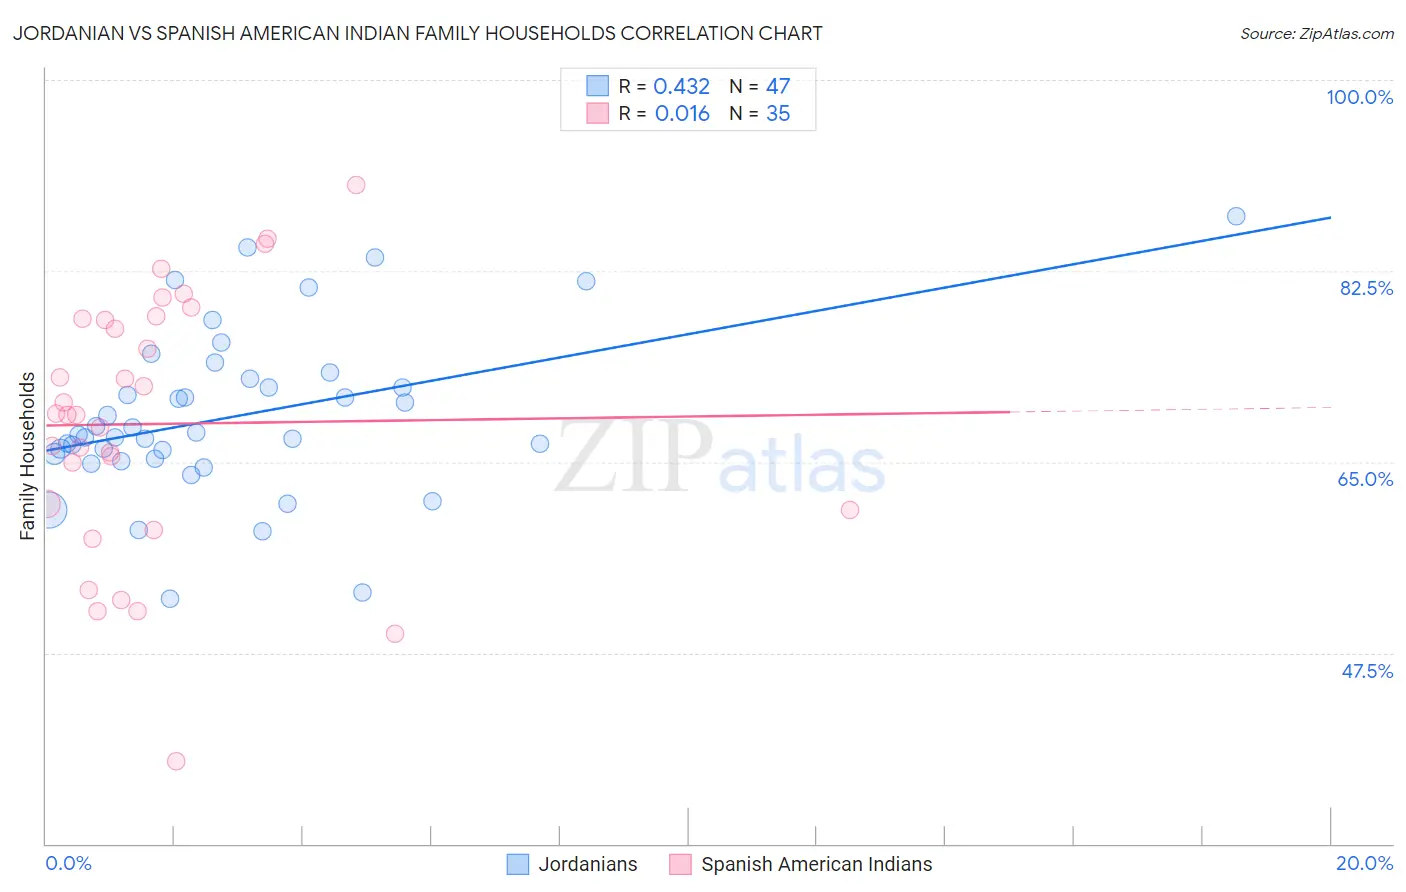
Jordanian vs Spanish American Indian Family Households Correlation Chart
The statistical analysis conducted on geographies consisting of 166,395,405 people shows a moderate positive correlation between the proportion of Jordanians and percentage of family households in the United States with a correlation coefficient (R) of 0.432 and weighted average of 65.5%. Similarly, the statistical analysis conducted on geographies consisting of 73,145,550 people shows no correlation between the proportion of Spanish American Indians and percentage of family households in the United States with a correlation coefficient (R) of 0.016 and weighted average of 71.2%, a difference of 8.6%.
Family Households Correlation Summary
| Measurement | Jordanian | Spanish American Indian |
| Minimum | 52.5% | 37.6% |
| Maximum | 87.5% | 90.4% |
| Range | 35.0% | 52.8% |
| Mean | 69.1% | 68.5% |
| Median | 67.5% | 69.3% |
| Interquartile 25% (IQ1) | 65.3% | 60.6% |
| Interquartile 75% (IQ3) | 72.6% | 78.1% |
| Interquartile Range (IQR) | 7.3% | 17.5% |
| Standard Deviation (Sample) | 7.5% | 11.9% |
| Standard Deviation (Population) | 7.5% | 11.8% |
Similar Demographics by Family Households
Demographics Similar to Jordanians by Family Households
In terms of family households, the demographic groups most similar to Jordanians are Immigrants from Lebanon (65.5%, a difference of 0.040%), Immigrants from Guyana (65.5%, a difference of 0.040%), American (65.5%, a difference of 0.060%), Puget Sound Salish (65.6%, a difference of 0.080%), and Immigrants from Costa Rica (65.6%, a difference of 0.10%).
| Demographics | Rating | Rank | Family Households |
| Burmese | 99.9 /100 | #74 | Exceptional 65.7% |
| Houma | 99.9 /100 | #75 | Exceptional 65.7% |
| Immigrants | Azores | 99.8 /100 | #76 | Exceptional 65.6% |
| Immigrants | South America | 99.8 /100 | #77 | Exceptional 65.6% |
| Yaqui | 99.8 /100 | #78 | Exceptional 65.6% |
| Immigrants | Costa Rica | 99.8 /100 | #79 | Exceptional 65.6% |
| Puget Sound Salish | 99.8 /100 | #80 | Exceptional 65.6% |
| Jordanians | 99.7 /100 | #81 | Exceptional 65.5% |
| Immigrants | Lebanon | 99.7 /100 | #82 | Exceptional 65.5% |
| Immigrants | Guyana | 99.6 /100 | #83 | Exceptional 65.5% |
| Americans | 99.6 /100 | #84 | Exceptional 65.5% |
| Immigrants | Cambodia | 99.5 /100 | #85 | Exceptional 65.4% |
| Egyptians | 99.4 /100 | #86 | Exceptional 65.4% |
| Immigrants | Egypt | 99.2 /100 | #87 | Exceptional 65.3% |
| Immigrants | Haiti | 99.1 /100 | #88 | Exceptional 65.3% |
Demographics Similar to Spanish American Indians by Family Households
In terms of family households, the demographic groups most similar to Spanish American Indians are Yup'ik (72.4%, a difference of 1.8%), Tongan (69.6%, a difference of 2.2%), Yakama (69.3%, a difference of 2.7%), Yuman (69.3%, a difference of 2.7%), and Immigrants from Mexico (69.1%, a difference of 2.9%).
| Demographics | Rating | Rank | Family Households |
| Yup'ik | 100 /100 | #1 | Exceptional 72.4% |
| Spanish American Indians | 100.0 /100 | #2 | Exceptional 71.2% |
| Tongans | 100.0 /100 | #3 | Exceptional 69.6% |
| Yakama | 100.0 /100 | #4 | Exceptional 69.3% |
| Yuman | 100.0 /100 | #5 | Exceptional 69.3% |
| Immigrants | Mexico | 100.0 /100 | #6 | Exceptional 69.1% |
| Mexicans | 100.0 /100 | #7 | Exceptional 69.0% |
| Immigrants | Fiji | 100.0 /100 | #8 | Exceptional 68.8% |
| Native Hawaiians | 100.0 /100 | #9 | Exceptional 68.4% |
| Immigrants | Philippines | 100.0 /100 | #10 | Exceptional 68.3% |
| Immigrants | Central America | 100.0 /100 | #11 | Exceptional 68.3% |
| Koreans | 100.0 /100 | #12 | Exceptional 68.3% |
| Pueblo | 100.0 /100 | #13 | Exceptional 68.2% |
| Immigrants | Cuba | 100.0 /100 | #14 | Exceptional 68.2% |
| Assyrians/Chaldeans/Syriacs | 100.0 /100 | #15 | Exceptional 68.2% |