Jordanian vs Immigrants from Kazakhstan Births to Unmarried Women
COMPARE
Jordanian
Immigrants from Kazakhstan
Births to Unmarried Women
Births to Unmarried Women Comparison
Jordanians
Immigrants from Kazakhstan
28.5%
BIRTHS TO UNMARRIED WOMEN
98.5/ 100
METRIC RATING
71st/ 347
METRIC RANK
28.1%
BIRTHS TO UNMARRIED WOMEN
99.1/ 100
METRIC RATING
59th/ 347
METRIC RANK
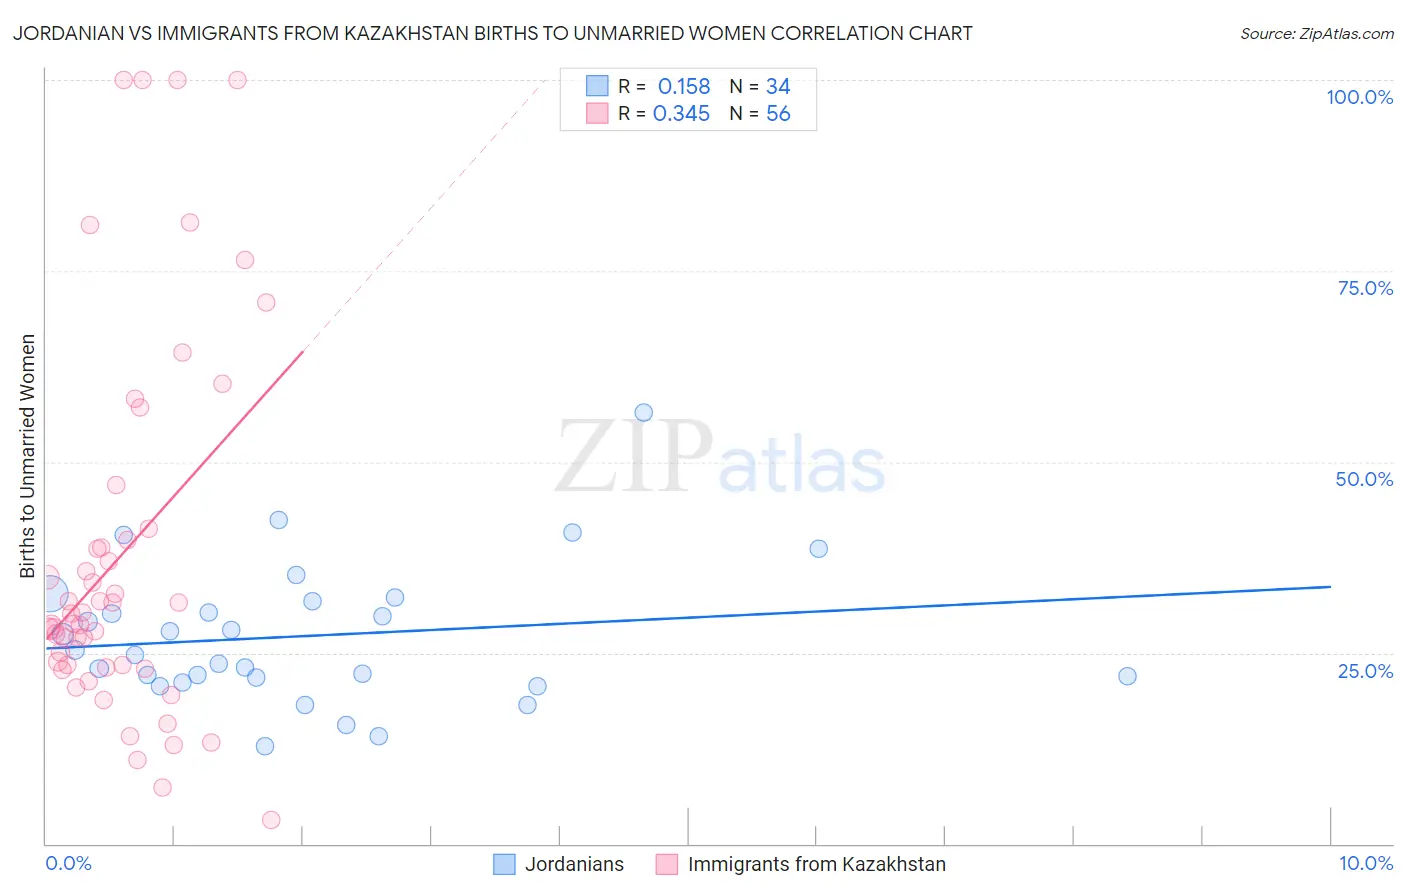
Jordanian vs Immigrants from Kazakhstan Births to Unmarried Women Correlation Chart
The statistical analysis conducted on geographies consisting of 160,910,775 people shows a poor positive correlation between the proportion of Jordanians and percentage of births to unmarried women in the United States with a correlation coefficient (R) of 0.158 and weighted average of 28.5%. Similarly, the statistical analysis conducted on geographies consisting of 120,028,218 people shows a mild positive correlation between the proportion of Immigrants from Kazakhstan and percentage of births to unmarried women in the United States with a correlation coefficient (R) of 0.345 and weighted average of 28.1%, a difference of 1.4%.
Births to Unmarried Women Correlation Summary
| Measurement | Jordanian | Immigrants from Kazakhstan |
| Minimum | 12.8% | 3.1% |
| Maximum | 56.4% | 100.0% |
| Range | 43.6% | 96.9% |
| Mean | 27.2% | 37.8% |
| Median | 25.0% | 29.4% |
| Interquartile 25% (IQ1) | 21.7% | 23.2% |
| Interquartile 75% (IQ3) | 31.7% | 40.5% |
| Interquartile Range (IQR) | 10.0% | 17.2% |
| Standard Deviation (Sample) | 9.1% | 24.5% |
| Standard Deviation (Population) | 9.0% | 24.3% |
Demographics Similar to Jordanians and Immigrants from Kazakhstan by Births to Unmarried Women
In terms of births to unmarried women, the demographic groups most similar to Jordanians are Immigrants from Sweden (28.5%, a difference of 0.060%), Albanian (28.5%, a difference of 0.11%), Immigrants from Bolivia (28.6%, a difference of 0.13%), Laotian (28.5%, a difference of 0.18%), and Immigrants from Switzerland (28.6%, a difference of 0.22%). Similarly, the demographic groups most similar to Immigrants from Kazakhstan are Immigrants from Turkey (28.1%, a difference of 0.040%), Immigrants from North Macedonia (28.1%, a difference of 0.090%), Immigrants from Albania (28.0%, a difference of 0.25%), Russian (28.0%, a difference of 0.36%), and Egyptian (28.2%, a difference of 0.41%).
| Demographics | Rating | Rank | Births to Unmarried Women |
| Mongolians | 99.3 /100 | #55 | Exceptional 27.9% |
| Immigrants | Belgium | 99.3 /100 | #56 | Exceptional 28.0% |
| Russians | 99.2 /100 | #57 | Exceptional 28.0% |
| Immigrants | Albania | 99.2 /100 | #58 | Exceptional 28.0% |
| Immigrants | Kazakhstan | 99.1 /100 | #59 | Exceptional 28.1% |
| Immigrants | Turkey | 99.1 /100 | #60 | Exceptional 28.1% |
| Immigrants | North Macedonia | 99.1 /100 | #61 | Exceptional 28.1% |
| Egyptians | 99.0 /100 | #62 | Exceptional 28.2% |
| Immigrants | Serbia | 98.9 /100 | #63 | Exceptional 28.3% |
| Tongans | 98.8 /100 | #64 | Exceptional 28.4% |
| Immigrants | Czechoslovakia | 98.8 /100 | #65 | Exceptional 28.4% |
| Immigrants | Egypt | 98.8 /100 | #66 | Exceptional 28.4% |
| Palestinians | 98.7 /100 | #67 | Exceptional 28.4% |
| Immigrants | Europe | 98.7 /100 | #68 | Exceptional 28.4% |
| Bolivians | 98.7 /100 | #69 | Exceptional 28.5% |
| Laotians | 98.6 /100 | #70 | Exceptional 28.5% |
| Jordanians | 98.5 /100 | #71 | Exceptional 28.5% |
| Immigrants | Sweden | 98.5 /100 | #72 | Exceptional 28.5% |
| Albanians | 98.5 /100 | #73 | Exceptional 28.5% |
| Immigrants | Bolivia | 98.5 /100 | #74 | Exceptional 28.6% |
| Immigrants | Switzerland | 98.4 /100 | #75 | Exceptional 28.6% |