Jamaican vs Immigrants from Southern Europe Family Households
COMPARE
Jamaican
Immigrants from Southern Europe
Family Households
Family Households Comparison
Jamaicans
Immigrants from Southern Europe
64.2%
FAMILY HOUSEHOLDS
40.6/ 100
METRIC RATING
178th/ 347
METRIC RANK
64.4%
FAMILY HOUSEHOLDS
60.0/ 100
METRIC RATING
165th/ 347
METRIC RANK
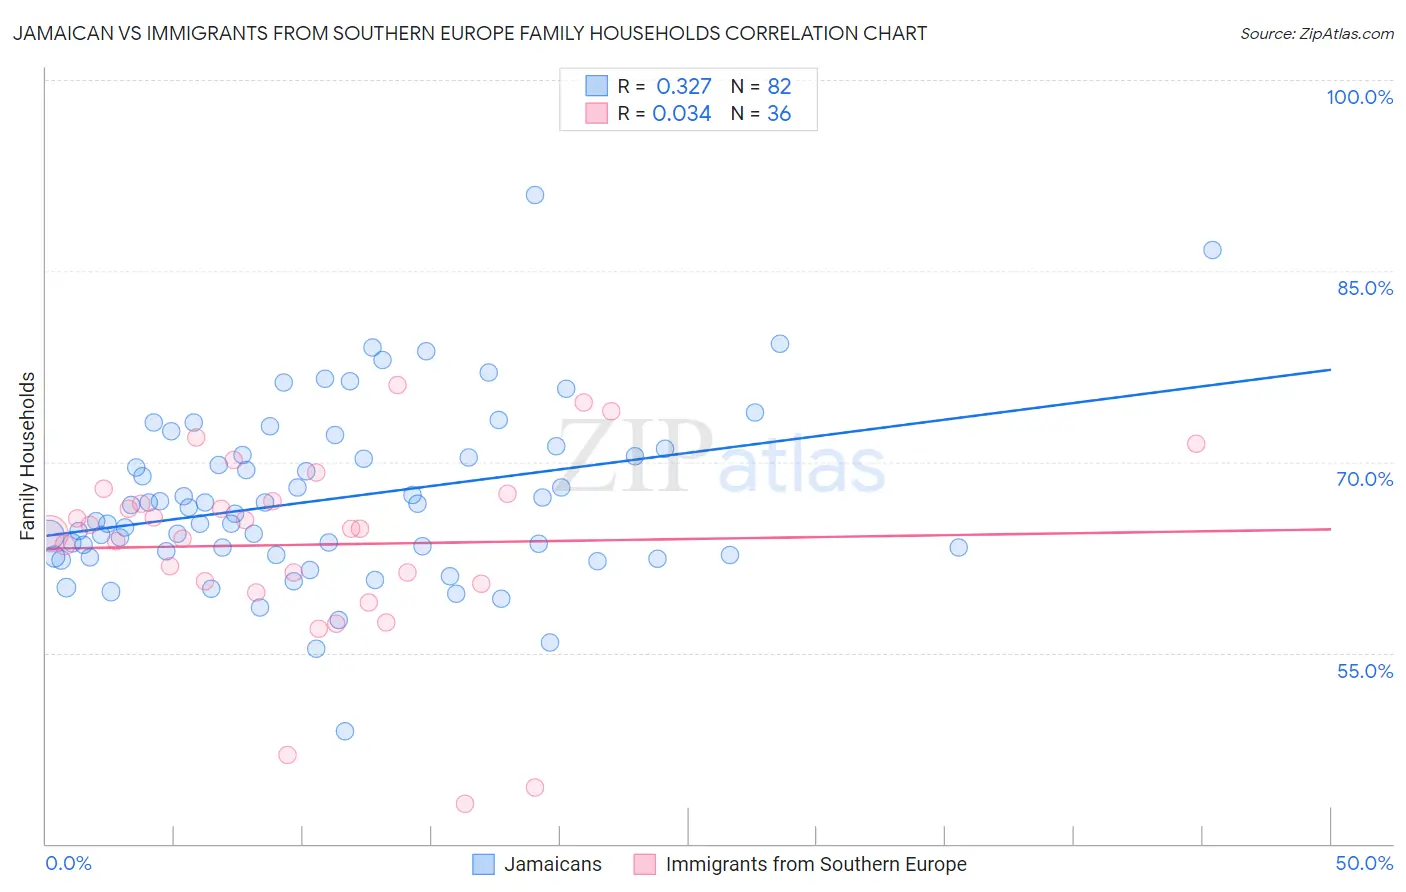
Jamaican vs Immigrants from Southern Europe Family Households Correlation Chart
The statistical analysis conducted on geographies consisting of 367,646,383 people shows a mild positive correlation between the proportion of Jamaicans and percentage of family households in the United States with a correlation coefficient (R) of 0.327 and weighted average of 64.2%. Similarly, the statistical analysis conducted on geographies consisting of 402,628,805 people shows no correlation between the proportion of Immigrants from Southern Europe and percentage of family households in the United States with a correlation coefficient (R) of 0.034 and weighted average of 64.4%, a difference of 0.26%.
Family Households Correlation Summary
| Measurement | Jamaican | Immigrants from Southern Europe |
| Minimum | 48.9% | 43.1% |
| Maximum | 91.0% | 76.0% |
| Range | 42.1% | 32.9% |
| Mean | 67.1% | 63.5% |
| Median | 66.2% | 64.7% |
| Interquartile 25% (IQ1) | 62.7% | 60.5% |
| Interquartile 75% (IQ3) | 70.6% | 67.2% |
| Interquartile Range (IQR) | 7.9% | 6.7% |
| Standard Deviation (Sample) | 6.8% | 7.4% |
| Standard Deviation (Population) | 6.8% | 7.3% |
Demographics Similar to Jamaicans and Immigrants from Southern Europe by Family Households
In terms of family households, the demographic groups most similar to Jamaicans are Immigrants from Micronesia (64.2%, a difference of 0.020%), Immigrants from Ukraine (64.2%, a difference of 0.030%), Vietnamese (64.2%, a difference of 0.040%), Bangladeshi (64.3%, a difference of 0.050%), and Immigrants from Honduras (64.2%, a difference of 0.080%). Similarly, the demographic groups most similar to Immigrants from Southern Europe are Immigrants from Nigeria (64.4%, a difference of 0.0%), Scotch-Irish (64.4%, a difference of 0.010%), British (64.4%, a difference of 0.020%), Chickasaw (64.4%, a difference of 0.020%), and Irish (64.4%, a difference of 0.030%).
| Demographics | Rating | Rank | Family Households |
| Immigrants | England | 62.6 /100 | #161 | Good 64.4% |
| British | 61.6 /100 | #162 | Good 64.4% |
| Chickasaw | 61.5 /100 | #163 | Good 64.4% |
| Immigrants | Nigeria | 60.1 /100 | #164 | Good 64.4% |
| Immigrants | Southern Europe | 60.0 /100 | #165 | Good 64.4% |
| Scotch-Irish | 59.2 /100 | #166 | Average 64.4% |
| Irish | 57.9 /100 | #167 | Average 64.4% |
| Hondurans | 57.5 /100 | #168 | Average 64.4% |
| Iraqis | 56.0 /100 | #169 | Average 64.4% |
| Armenians | 55.9 /100 | #170 | Average 64.4% |
| Ute | 54.6 /100 | #171 | Average 64.3% |
| Dutch West Indians | 53.9 /100 | #172 | Average 64.3% |
| Immigrants | Sierra Leone | 52.5 /100 | #173 | Average 64.3% |
| Immigrants | Germany | 50.0 /100 | #174 | Average 64.3% |
| Bangladeshis | 44.3 /100 | #175 | Average 64.3% |
| Vietnamese | 43.6 /100 | #176 | Average 64.2% |
| Immigrants | Micronesia | 42.3 /100 | #177 | Average 64.2% |
| Jamaicans | 40.6 /100 | #178 | Average 64.2% |
| Immigrants | Ukraine | 38.2 /100 | #179 | Fair 64.2% |
| Immigrants | Honduras | 35.0 /100 | #180 | Fair 64.2% |
| Immigrants | Trinidad and Tobago | 34.9 /100 | #181 | Fair 64.2% |