Jamaican vs Albanian Currently Married

COMPARE

Jamaican
Race
Ancestry
AfghanAfricanAlaska NativeAlaskan AthabascanAleutAlsatianAmericanApacheArabArapahoArgentineanArmenianAssyrian/Chaldean/SyriacAustralianAustrianBahamianBangladeshiBarbadianBasqueBelgianBelizeanBermudanBhutaneseBlackfeetBolivianBrazilianBritishBritish West IndianBulgarianBurmeseCajunCambodianCanadianCape VerdeanCarpatho RusynCelticCentral AmericanCentral American IndianCherokeeCheyenneChickasawChileanChineseChippewaChoctawColombianColvilleComancheCosta RicanCreeCreekCroatianCrowCubanCypriotCzechCzechoslovakianDanishDelawareDominicanDutchDutch West IndianEastern EuropeanEcuadorianEgyptianEnglishEstonianEthiopianEuropeanFijianFilipinoFinnishFrenchFrench American IndianFrench CanadianGermanGerman RussianGhanaianGreekGuamanian/ChamorroGuatemalanGuyaneseHaitianHmongHonduranHopiHoumaHungarianIcelanderIndian (Asian)IndonesianInupiatIranianIraqiIrishIroquoisIsraeliItalianJamaicanJapaneseJordanianKenyanKiowaKoreanLaotianLatvianLebaneseLiberianLithuanianLumbeeLuxembourgerMacedonianMalaysianMalteseMarshalleseMenomineeMexicanMexican American IndianMongolianMoroccanNative HawaiianNavajoNepaleseNew ZealanderNicaraguanNigerianNorthern EuropeanNorwegianOkinawanOsageOttawaPaiutePakistaniPalestinianPanamanianParaguayanPennsylvania GermanPeruvianPimaPolishPortuguesePotawatomiPuebloPuerto RicanPuget Sound SalishRomanianRussianSalvadoranSamoanScandinavianScotch-IrishScottishSeminoleSenegaleseSerbianShoshoneSierra LeoneanSiouxSlavicSlovakSloveneSomaliSouth AfricanSouth AmericanSouth American IndianSoviet UnionSpaniardSpanishSpanish AmericanSpanish American IndianSri LankanSubsaharan AfricanSudaneseSwedishSwissSyrianTaiwaneseThaiTlingit-HaidaTohono O'OdhamTonganTrinidadian and TobagonianTsimshianTurkishU.S. Virgin IslanderUgandanUkrainianUruguayanUteVenezuelanVietnameseWelshWest IndianYakamaYaquiYugoslavianYumanYup'ikZimbabwean
Immigration
NonimmigrantsImmigrantsAfghanistanAfricaAlbaniaArgentinaArmeniaAsiaAustraliaAustriaBahamasBangladeshBarbadosBelarusBelgiumBelizeBoliviaBosnia and HerzegovinaBrazilBulgariaBurma/MyanmarCabo VerdeCambodiaCameroonCanadaCaribbeanCentral AmericaChileChinaColombiaCongoCosta RicaCroatiaCubaCzechoslovakiaDenmarkDominicaDominican RepublicEastern AfricaEastern AsiaEastern EuropeEcuadorEgyptEl SalvadorEnglandEritreaEthiopiaEuropeFijiFranceGermanyGhanaGreeceGrenadaGuatemalaGuyanaHaitiHondurasHong KongHungaryIndiaIndonesiaIranIraqIrelandIsraelItalyJamaicaJapanJordanKazakhstanKenyaKoreaKuwaitLaosLatin AmericaLatviaLebanonLiberiaLithuaniaMalaysiaMexicoMicronesiaMiddle AfricaMoldovaMoroccoNepalNetherlandsNicaraguaNigeriaNorth AmericaNorth MacedoniaNorthern AfricaNorthern EuropeNorwayOceaniaPakistanPanamaPeruPhilippinesPolandPortugalRomaniaRussiaSaudi ArabiaScotlandSenegalSerbiaSierra LeoneSingaporeSomaliaSouth AfricaSouth AmericaSouth Central AsiaSouth Eastern AsiaSouthern EuropeSpainSri LankaSt. Vincent and the GrenadinesSudanSwedenSwitzerlandSyriaTaiwanThailandTrinidad and TobagoTurkeyUgandaUkraineUruguayUzbekistanVenezuelaVietnamWest IndiesWestern AfricaWestern AsiaWestern EuropeYemenZaireZimbabweAzores
Albanian
Race
Ancestry
AfghanAfricanAlaska NativeAlaskan AthabascanAlbanianAleutAlsatianAmericanApacheArabArapahoArgentineanArmenianAssyrian/Chaldean/SyriacAustralianAustrianBahamianBangladeshiBarbadianBasqueBelgianBelizeanBermudanBhutaneseBlackfeetBolivianBrazilianBritishBritish West IndianBulgarianBurmeseCajunCambodianCanadianCape VerdeanCarpatho RusynCelticCentral AmericanCentral American IndianCherokeeCheyenneChickasawChileanChineseChippewaChoctawColombianColvilleComancheCosta RicanCreeCreekCroatianCrowCubanCypriotCzechCzechoslovakianDanishDelawareDominicanDutchDutch West IndianEastern EuropeanEcuadorianEgyptianEnglishEstonianEthiopianEuropeanFijianFilipinoFinnishFrenchFrench American IndianFrench CanadianGermanGerman RussianGhanaianGreekGuamanian/ChamorroGuatemalanGuyaneseHaitianHmongHonduranHopiHoumaHungarianIcelanderIndian (Asian)IndonesianInupiatIranianIraqiIrishIroquoisIsraeliItalianJapaneseJordanianKenyanKiowaKoreanLaotianLatvianLebaneseLiberianLithuanianLumbeeLuxembourgerMacedonianMalaysianMalteseMarshalleseMenomineeMexicanMexican American IndianMongolianMoroccanNative HawaiianNavajoNepaleseNew ZealanderNicaraguanNigerianNorthern EuropeanNorwegianOkinawanOsageOttawaPaiutePakistaniPalestinianPanamanianParaguayanPennsylvania GermanPeruvianPimaPolishPortuguesePotawatomiPuebloPuerto RicanPuget Sound SalishRomanianRussianSalvadoranSamoanScandinavianScotch-IrishScottishSeminoleSenegaleseSerbianShoshoneSierra LeoneanSiouxSlavicSlovakSloveneSomaliSouth AfricanSouth AmericanSouth American IndianSoviet UnionSpaniardSpanishSpanish AmericanSpanish American IndianSri LankanSubsaharan AfricanSudaneseSwedishSwissSyrianTaiwaneseThaiTlingit-HaidaTohono O'OdhamTonganTrinidadian and TobagonianTsimshianTurkishU.S. Virgin IslanderUgandanUkrainianUruguayanUteVenezuelanVietnameseWelshWest IndianYakamaYaquiYugoslavianYumanYup'ikZimbabwean
Immigration
NonimmigrantsImmigrantsAfghanistanAfricaAlbaniaArgentinaArmeniaAsiaAustraliaAustriaBahamasBangladeshBarbadosBelarusBelgiumBelizeBoliviaBosnia and HerzegovinaBrazilBulgariaBurma/MyanmarCabo VerdeCambodiaCameroonCanadaCaribbeanCentral AmericaChileChinaColombiaCongoCosta RicaCroatiaCubaCzechoslovakiaDenmarkDominicaDominican RepublicEastern AfricaEastern AsiaEastern EuropeEcuadorEgyptEl SalvadorEnglandEritreaEthiopiaEuropeFijiFranceGermanyGhanaGreeceGrenadaGuatemalaGuyanaHaitiHondurasHong KongHungaryIndiaIndonesiaIranIraqIrelandIsraelItalyJamaicaJapanJordanKazakhstanKenyaKoreaKuwaitLaosLatin AmericaLatviaLebanonLiberiaLithuaniaMalaysiaMexicoMicronesiaMiddle AfricaMoldovaMoroccoNepalNetherlandsNicaraguaNigeriaNorth AmericaNorth MacedoniaNorthern AfricaNorthern EuropeNorwayOceaniaPakistanPanamaPeruPhilippinesPolandPortugalRomaniaRussiaSaudi ArabiaScotlandSenegalSerbiaSierra LeoneSingaporeSomaliaSouth AfricaSouth AmericaSouth Central AsiaSouth Eastern AsiaSouthern EuropeSpainSri LankaSt. Vincent and the GrenadinesSudanSwedenSwitzerlandSyriaTaiwanThailandTrinidad and TobagoTurkeyUgandaUkraineUruguayUzbekistanVenezuelaVietnamWest IndiesWestern AfricaWestern AsiaWestern EuropeYemenZaireZimbabweAzores
Currently Married
Income
Poverty
Unemployment
Labor Participation
Family Structure
Vehicle Availability
Education Level
Disability

Currently Married Comparison

Jamaicans

Albanians

Tragic
Good
41.4%
CURRENTLY MARRIED
0.0/ 100
METRIC RATING
313th/ 347
METRIC RANK
47.0%
CURRENTLY MARRIED
68.6/ 100
METRIC RATING
154th/ 347
METRIC RANK

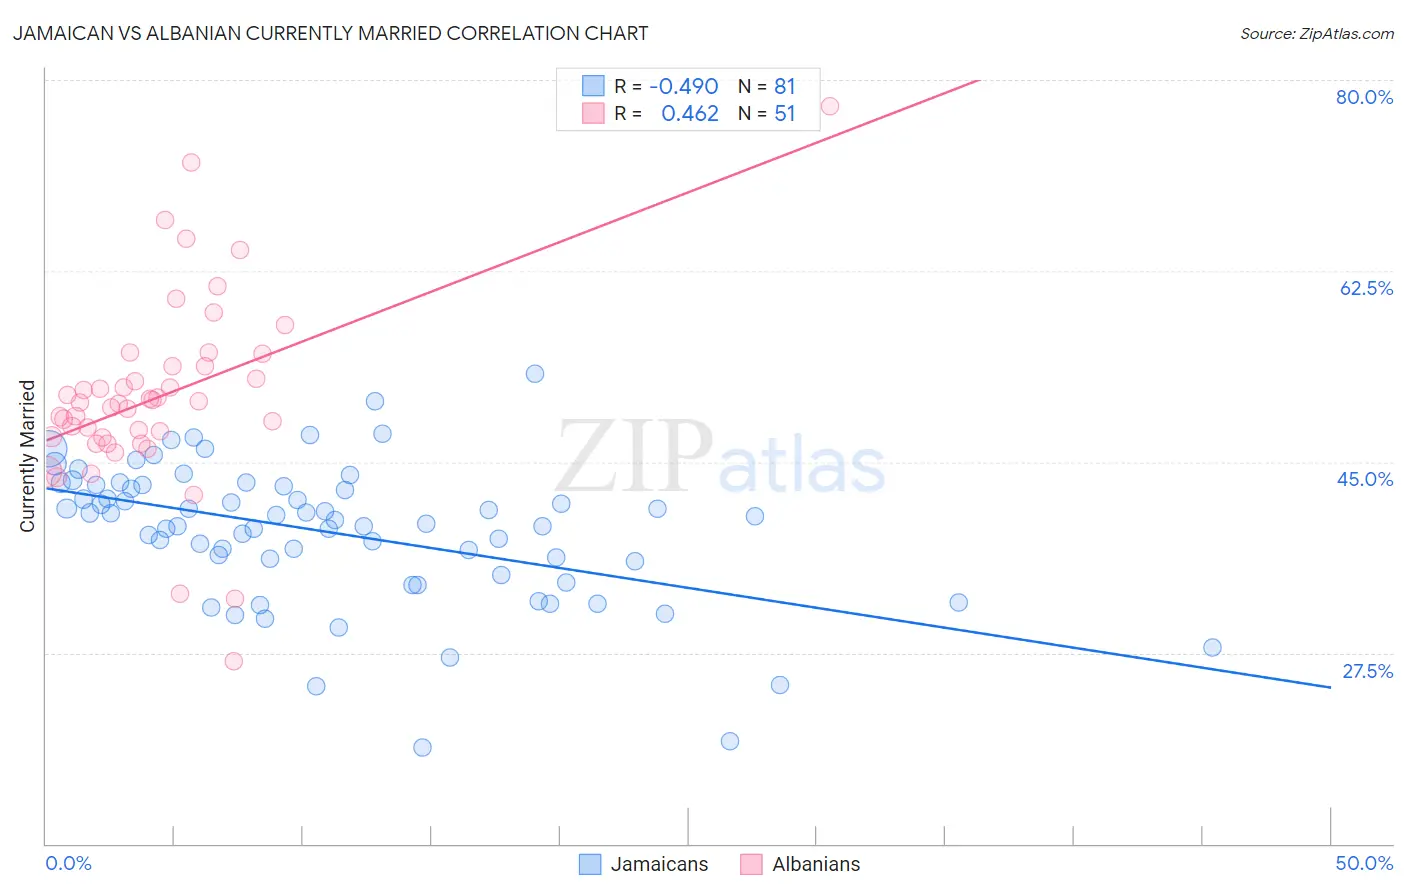
Jamaican vs Albanian Currently Married Correlation Chart

The statistical analysis conducted on geographies consisting of 368,004,365 people shows a moderate negative correlation between the proportion of Jamaicans and percentage of population currently married in the United States with a correlation coefficient (R) of -0.490 and weighted average of 41.4%. Similarly, the statistical analysis conducted on geographies consisting of 193,235,745 people shows a moderate positive correlation between the proportion of Albanians and percentage of population currently married in the United States with a correlation coefficient (R) of 0.462 and weighted average of 47.0%, a difference of 13.6%.
Jamaican vs Albanian Currently Married

Currently Married Correlation Summary

MeasurementJamaicanAlbanian
Minimum18.8%26.7%
Maximum53.1%77.6%
Range34.3%50.9%
Mean38.5%51.0%
Median39.6%50.5%
Interquartile 25% (IQ1)35.2%47.2%
Interquartile 75% (IQ3)42.9%53.7%
Interquartile Range (IQR)7.6%6.5%
Standard Deviation (Sample)6.4%8.8%
Standard Deviation (Population)6.4%8.7%

Similar Demographics by Currently Married

Demographics Similar to Jamaicans by Currently Married

In terms of currently married, the demographic groups most similar to Jamaicans are West Indian (41.3%, a difference of 0.080%), Inupiat (41.3%, a difference of 0.16%), Immigrants from Caribbean (41.3%, a difference of 0.22%), Haitian (41.3%, a difference of 0.24%), and Somali (41.5%, a difference of 0.29%).
DemographicsRating | RankCurrently Married
Immigrants | Guyana
0.0
/100
|
#306
Tragic
41.9%
Africans
0.0
/100
|
#307
Tragic
41.8%
Immigrants | Belize
0.0
/100
|
#308
Tragic
41.8%
Immigrants | Liberia
0.0
/100
|
#309
Tragic
41.8%
Guyanese
0.0
/100
|
#310
Tragic
41.6%
Trinidadians and Tobagonians
0.0
/100
|
#311
Tragic
41.5%
Somalis
0.0
/100
|
#312
Tragic
41.5%
Jamaicans
0.0
/100
|
#313
Tragic
41.4%
West Indians
0.0
/100
|
#314
Tragic
41.3%
Inupiat
0.0
/100
|
#315
Tragic
41.3%
Immigrants | Caribbean
0.0
/100
|
#316
Tragic
41.3%
Haitians
0.0
/100
|
#317
Tragic
41.3%
Bahamians
0.0
/100
|
#318
Tragic
41.2%
Immigrants | Somalia
0.0
/100
|
#319
Tragic
41.2%
Immigrants | Jamaica
0.0
/100
|
#320
Tragic
41.1%

Demographics Similar to Albanians by Currently Married

In terms of currently married, the demographic groups most similar to Albanians are Immigrants from Venezuela (47.0%, a difference of 0.0%), Arab (47.0%, a difference of 0.0%), Immigrants from Serbia (47.0%, a difference of 0.010%), Spanish (47.0%, a difference of 0.020%), and Immigrants from Switzerland (46.9%, a difference of 0.030%).
DemographicsRating | RankCurrently Married
Immigrants | Argentina
72.0
/100
|
#147
Good
47.0%
Cambodians
70.4
/100
|
#148
Good
47.0%
Zimbabweans
70.1
/100
|
#149
Good
47.0%
Immigrants | Turkey
70.0
/100
|
#150
Good
47.0%
Chileans
69.8
/100
|
#151
Good
47.0%
Immigrants | Serbia
68.8
/100
|
#152
Good
47.0%
Immigrants | Venezuela
68.6
/100
|
#153
Good
47.0%
Albanians
68.6
/100
|
#154
Good
47.0%
Arabs
68.6
/100
|
#155
Good
47.0%
Spanish
68.1
/100
|
#156
Good
47.0%
Immigrants | Switzerland
67.8
/100
|
#157
Good
46.9%
Cherokee
66.8
/100
|
#158
Good
46.9%
Iraqis
66.4
/100
|
#159
Good
46.9%
Immigrants | Uzbekistan
66.0
/100
|
#160
Good
46.9%
Immigrants | Southern Europe
65.9
/100
|
#161
Good
46.9%