Iraqi vs Cree Births to Unmarried Women
COMPARE
Iraqi
Cree
Births to Unmarried Women
Births to Unmarried Women Comparison
Iraqis
Cree
27.6%
BIRTHS TO UNMARRIED WOMEN
99.6/ 100
METRIC RATING
41st/ 347
METRIC RANK
37.0%
BIRTHS TO UNMARRIED WOMEN
0.1/ 100
METRIC RATING
274th/ 347
METRIC RANK
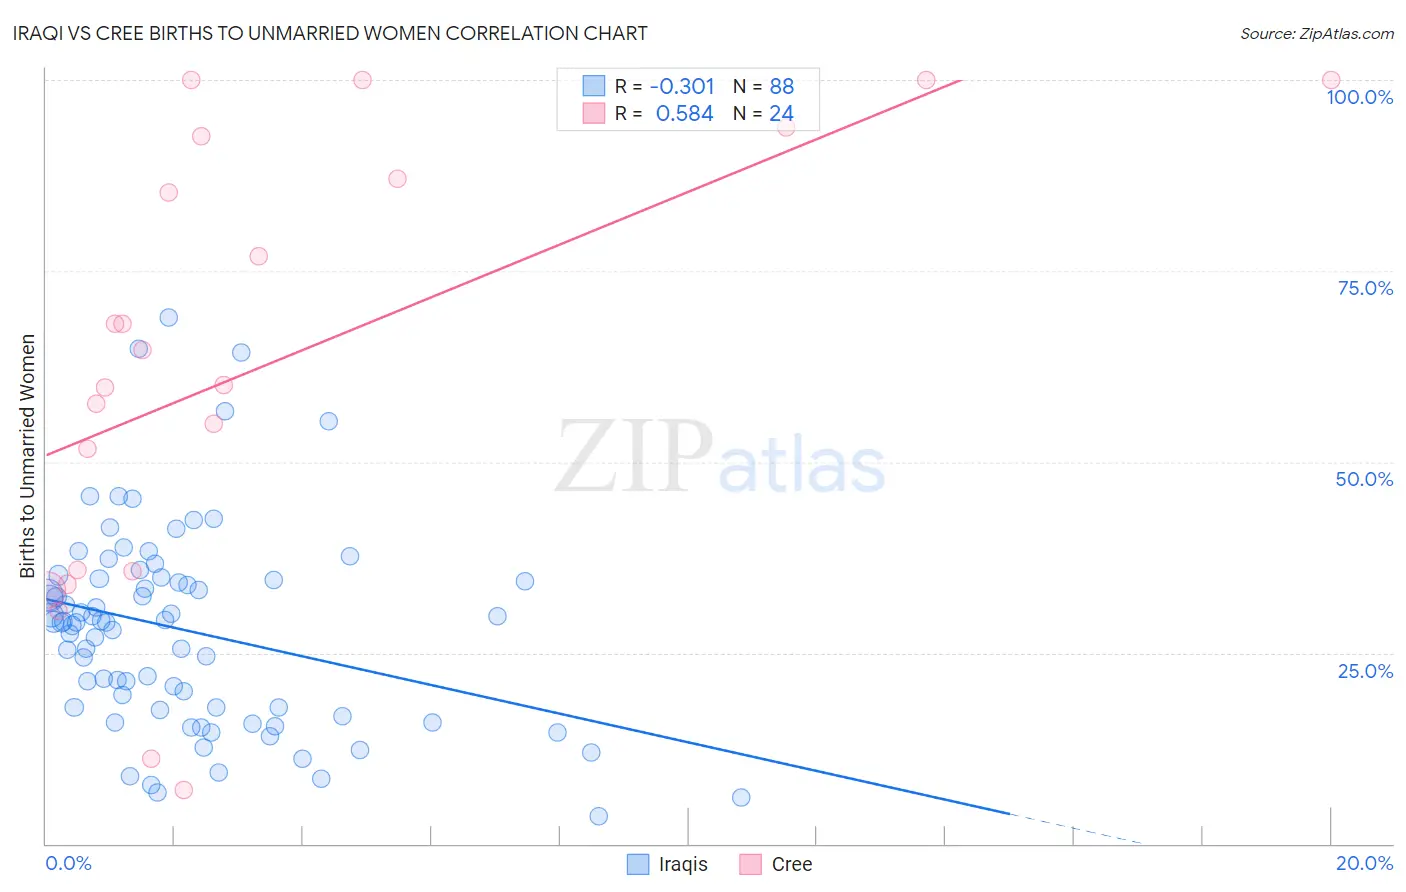
Iraqi vs Cree Births to Unmarried Women Correlation Chart
The statistical analysis conducted on geographies consisting of 164,715,067 people shows a mild negative correlation between the proportion of Iraqis and percentage of births to unmarried women in the United States with a correlation coefficient (R) of -0.301 and weighted average of 27.6%. Similarly, the statistical analysis conducted on geographies consisting of 74,807,025 people shows a substantial positive correlation between the proportion of Cree and percentage of births to unmarried women in the United States with a correlation coefficient (R) of 0.584 and weighted average of 37.0%, a difference of 34.1%.
Births to Unmarried Women Correlation Summary
| Measurement | Iraqi | Cree |
| Minimum | 3.6% | 7.1% |
| Maximum | 68.9% | 100.0% |
| Range | 65.3% | 92.9% |
| Mean | 27.9% | 62.8% |
| Median | 29.0% | 62.3% |
| Interquartile 25% (IQ1) | 17.6% | 35.7% |
| Interquartile 75% (IQ3) | 34.6% | 89.8% |
| Interquartile Range (IQR) | 17.0% | 54.1% |
| Standard Deviation (Sample) | 13.3% | 28.7% |
| Standard Deviation (Population) | 13.2% | 28.1% |
Similar Demographics by Births to Unmarried Women
Demographics Similar to Iraqis by Births to Unmarried Women
In terms of births to unmarried women, the demographic groups most similar to Iraqis are Immigrants from Eastern Europe (27.6%, a difference of 0.020%), Immigrants from Bulgaria (27.6%, a difference of 0.24%), Turkish (27.4%, a difference of 0.41%), Immigrants from Indonesia (27.7%, a difference of 0.51%), and Latvian (27.7%, a difference of 0.60%).
| Demographics | Rating | Rank | Births to Unmarried Women |
| Immigrants | Pakistan | 99.8 /100 | #34 | Exceptional 27.2% |
| Immigrants | Ireland | 99.7 /100 | #35 | Exceptional 27.2% |
| Immigrants | Western Asia | 99.7 /100 | #36 | Exceptional 27.2% |
| Immigrants | Ukraine | 99.7 /100 | #37 | Exceptional 27.2% |
| Immigrants | Moldova | 99.7 /100 | #38 | Exceptional 27.3% |
| Immigrants | Malaysia | 99.7 /100 | #39 | Exceptional 27.4% |
| Turks | 99.6 /100 | #40 | Exceptional 27.4% |
| Iraqis | 99.6 /100 | #41 | Exceptional 27.6% |
| Immigrants | Eastern Europe | 99.6 /100 | #42 | Exceptional 27.6% |
| Immigrants | Bulgaria | 99.6 /100 | #43 | Exceptional 27.6% |
| Immigrants | Indonesia | 99.5 /100 | #44 | Exceptional 27.7% |
| Latvians | 99.5 /100 | #45 | Exceptional 27.7% |
| Immigrants | Lithuania | 99.5 /100 | #46 | Exceptional 27.7% |
| Hmong | 99.5 /100 | #47 | Exceptional 27.7% |
| Eastern Europeans | 99.5 /100 | #48 | Exceptional 27.7% |
Demographics Similar to Cree by Births to Unmarried Women
In terms of births to unmarried women, the demographic groups most similar to Cree are Barbadian (37.0%, a difference of 0.030%), Mexican (36.9%, a difference of 0.090%), Choctaw (36.9%, a difference of 0.21%), Belizean (37.0%, a difference of 0.22%), and Immigrants from Barbados (36.8%, a difference of 0.43%).
| Demographics | Rating | Rank | Births to Unmarried Women |
| Central Americans | 0.1 /100 | #267 | Tragic 36.7% |
| Comanche | 0.1 /100 | #268 | Tragic 36.7% |
| Senegalese | 0.1 /100 | #269 | Tragic 36.8% |
| Immigrants | Congo | 0.1 /100 | #270 | Tragic 36.8% |
| Immigrants | Barbados | 0.1 /100 | #271 | Tragic 36.8% |
| Choctaw | 0.1 /100 | #272 | Tragic 36.9% |
| Mexicans | 0.1 /100 | #273 | Tragic 36.9% |
| Cree | 0.1 /100 | #274 | Tragic 37.0% |
| Barbadians | 0.1 /100 | #275 | Tragic 37.0% |
| Belizeans | 0.1 /100 | #276 | Tragic 37.0% |
| Guatemalans | 0.1 /100 | #277 | Tragic 37.1% |
| Immigrants | Latin America | 0.1 /100 | #278 | Tragic 37.1% |
| West Indians | 0.1 /100 | #279 | Tragic 37.3% |
| Immigrants | St. Vincent and the Grenadines | 0.1 /100 | #280 | Tragic 37.3% |
| Immigrants | Belize | 0.1 /100 | #281 | Tragic 37.3% |