Inupiat vs Immigrants from Uruguay Divorced or Separated
COMPARE
Inupiat
Immigrants from Uruguay
Divorced or Separated
Divorced or Separated Comparison
Inupiat
Immigrants from Uruguay
11.4%
DIVORCED OR SEPARATED
99.8/ 100
METRIC RATING
66th/ 347
METRIC RANK
12.6%
DIVORCED OR SEPARATED
0.6/ 100
METRIC RATING
260th/ 347
METRIC RANK
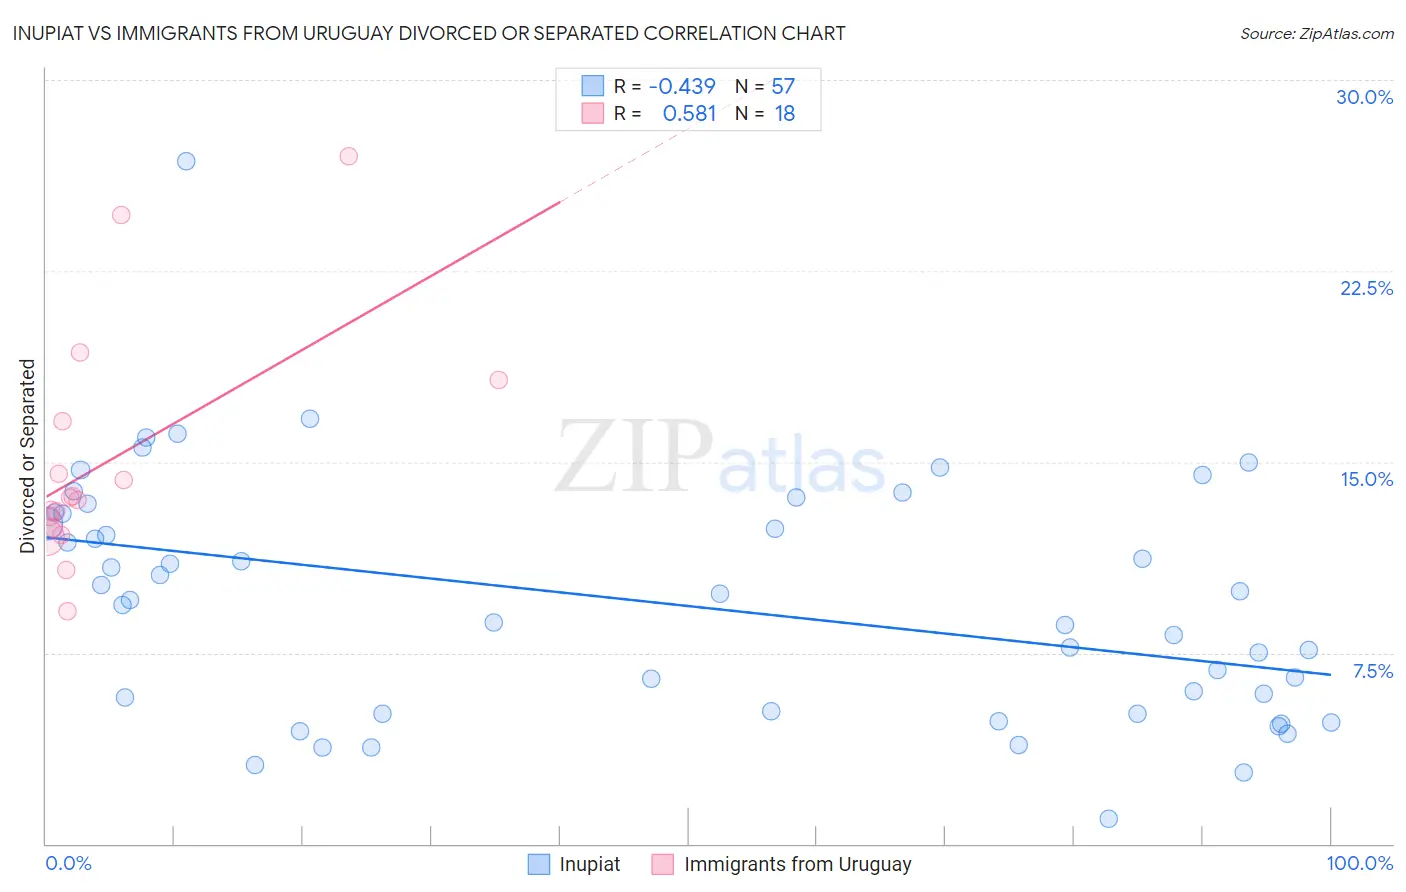
Inupiat vs Immigrants from Uruguay Divorced or Separated Correlation Chart
The statistical analysis conducted on geographies consisting of 96,343,887 people shows a moderate negative correlation between the proportion of Inupiat and percentage of population currently divorced or separated in the United States with a correlation coefficient (R) of -0.439 and weighted average of 11.4%. Similarly, the statistical analysis conducted on geographies consisting of 133,250,872 people shows a substantial positive correlation between the proportion of Immigrants from Uruguay and percentage of population currently divorced or separated in the United States with a correlation coefficient (R) of 0.581 and weighted average of 12.6%, a difference of 10.2%.
Divorced or Separated Correlation Summary
| Measurement | Inupiat | Immigrants from Uruguay |
| Minimum | 1.0% | 9.2% |
| Maximum | 26.8% | 27.0% |
| Range | 25.8% | 17.8% |
| Mean | 9.5% | 15.0% |
| Median | 9.6% | 13.6% |
| Interquartile 25% (IQ1) | 5.2% | 12.4% |
| Interquartile 75% (IQ3) | 13.0% | 16.6% |
| Interquartile Range (IQR) | 7.8% | 4.2% |
| Standard Deviation (Sample) | 4.7% | 4.6% |
| Standard Deviation (Population) | 4.7% | 4.5% |
Similar Demographics by Divorced or Separated
Demographics Similar to Inupiat by Divorced or Separated
In terms of divorced or separated, the demographic groups most similar to Inupiat are Immigrants from Syria (11.4%, a difference of 0.090%), Immigrants from South Eastern Asia (11.4%, a difference of 0.14%), Macedonian (11.4%, a difference of 0.18%), Palestinian (11.5%, a difference of 0.20%), and Immigrants from Belgium (11.5%, a difference of 0.21%).
| Demographics | Rating | Rank | Divorced or Separated |
| Israelis | 99.9 /100 | #59 | Exceptional 11.3% |
| Immigrants | Russia | 99.9 /100 | #60 | Exceptional 11.3% |
| Koreans | 99.9 /100 | #61 | Exceptional 11.3% |
| Luxembourgers | 99.9 /100 | #62 | Exceptional 11.3% |
| Immigrants | Kuwait | 99.9 /100 | #63 | Exceptional 11.3% |
| Macedonians | 99.8 /100 | #64 | Exceptional 11.4% |
| Immigrants | South Eastern Asia | 99.8 /100 | #65 | Exceptional 11.4% |
| Inupiat | 99.8 /100 | #66 | Exceptional 11.4% |
| Immigrants | Syria | 99.7 /100 | #67 | Exceptional 11.4% |
| Palestinians | 99.7 /100 | #68 | Exceptional 11.5% |
| Immigrants | Belgium | 99.7 /100 | #69 | Exceptional 11.5% |
| Immigrants | Eastern Europe | 99.7 /100 | #70 | Exceptional 11.5% |
| Paraguayans | 99.7 /100 | #71 | Exceptional 11.5% |
| Jordanians | 99.6 /100 | #72 | Exceptional 11.5% |
| Immigrants | North Macedonia | 99.6 /100 | #73 | Exceptional 11.5% |
Demographics Similar to Immigrants from Uruguay by Divorced or Separated
In terms of divorced or separated, the demographic groups most similar to Immigrants from Uruguay are Yuman (12.6%, a difference of 0.0%), Immigrants from Somalia (12.6%, a difference of 0.020%), Indonesian (12.6%, a difference of 0.020%), Immigrants from Dominica (12.6%, a difference of 0.030%), and Immigrants from Colombia (12.6%, a difference of 0.040%).
| Demographics | Rating | Rank | Divorced or Separated |
| Somalis | 0.9 /100 | #253 | Tragic 12.6% |
| Senegalese | 0.8 /100 | #254 | Tragic 12.6% |
| Welsh | 0.7 /100 | #255 | Tragic 12.6% |
| Immigrants | Colombia | 0.6 /100 | #256 | Tragic 12.6% |
| Immigrants | Somalia | 0.6 /100 | #257 | Tragic 12.6% |
| Indonesians | 0.6 /100 | #258 | Tragic 12.6% |
| Yuman | 0.6 /100 | #259 | Tragic 12.6% |
| Immigrants | Uruguay | 0.6 /100 | #260 | Tragic 12.6% |
| Immigrants | Dominica | 0.5 /100 | #261 | Tragic 12.6% |
| Basques | 0.5 /100 | #262 | Tragic 12.6% |
| Immigrants | Panama | 0.5 /100 | #263 | Tragic 12.6% |
| English | 0.5 /100 | #264 | Tragic 12.6% |
| Immigrants | Senegal | 0.5 /100 | #265 | Tragic 12.6% |
| Whites/Caucasians | 0.5 /100 | #266 | Tragic 12.6% |
| Scottish | 0.4 /100 | #267 | Tragic 12.6% |