Inupiat vs Central American Indian Single Mother Households
COMPARE
Inupiat
Central American Indian
Single Mother Households
Single Mother Households Comparison
Inupiat
Central American Indians
8.5%
SINGLE MOTHER HOUSEHOLDS
0.0/ 100
METRIC RATING
330th/ 347
METRIC RANK
7.6%
SINGLE MOTHER HOUSEHOLDS
0.1/ 100
METRIC RATING
275th/ 347
METRIC RANK
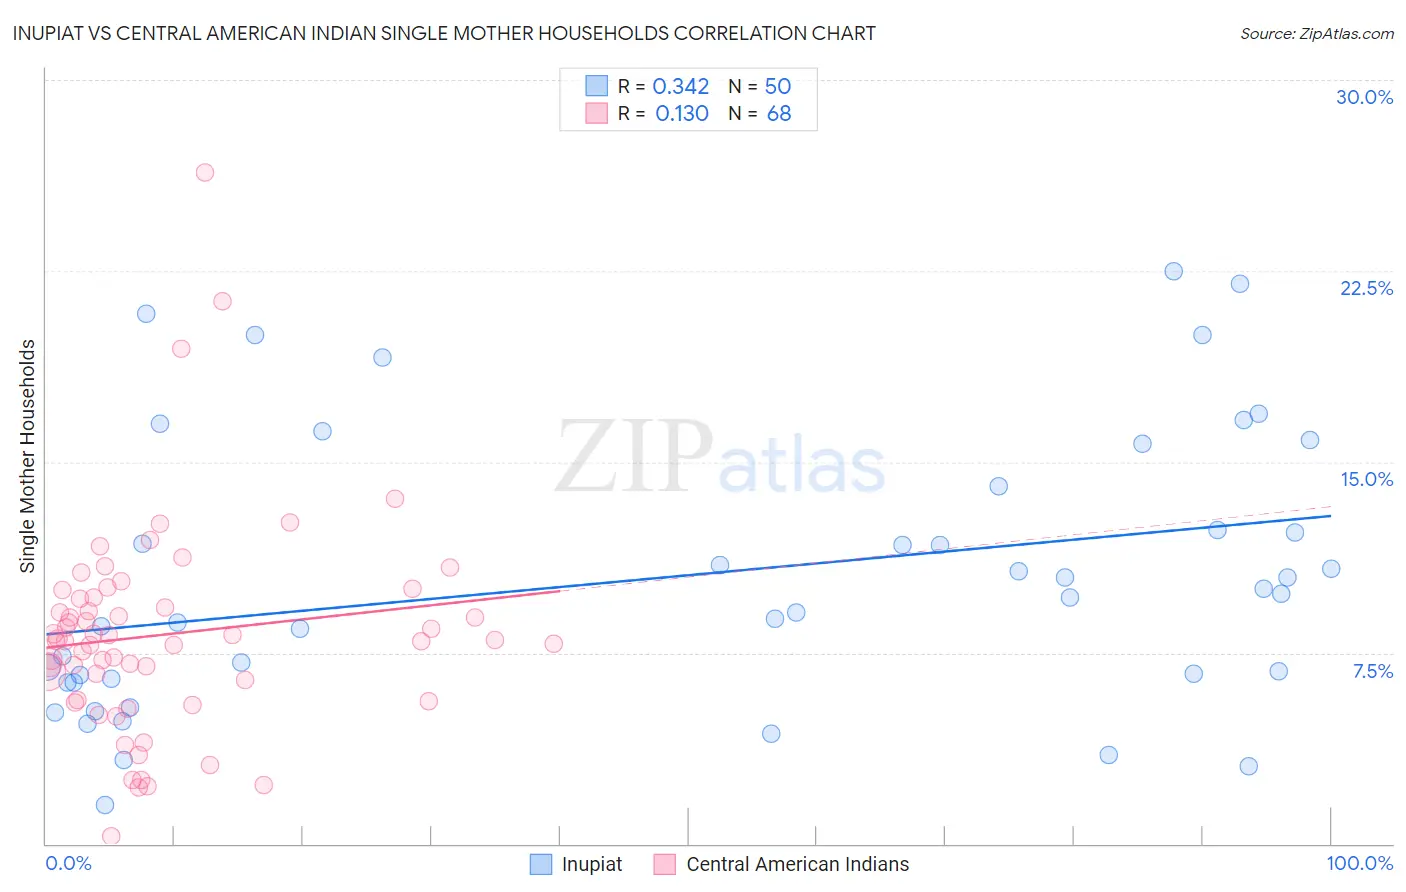
Inupiat vs Central American Indian Single Mother Households Correlation Chart
The statistical analysis conducted on geographies consisting of 96,271,599 people shows a mild positive correlation between the proportion of Inupiat and percentage of single mother households in the United States with a correlation coefficient (R) of 0.342 and weighted average of 8.5%. Similarly, the statistical analysis conducted on geographies consisting of 325,810,321 people shows a poor positive correlation between the proportion of Central American Indians and percentage of single mother households in the United States with a correlation coefficient (R) of 0.130 and weighted average of 7.6%, a difference of 12.1%.
Single Mother Households Correlation Summary
| Measurement | Inupiat | Central American Indian |
| Minimum | 1.5% | 0.29% |
| Maximum | 22.5% | 26.4% |
| Range | 21.0% | 26.1% |
| Mean | 10.5% | 8.2% |
| Median | 9.7% | 8.0% |
| Interquartile 25% (IQ1) | 6.5% | 6.0% |
| Interquartile 75% (IQ3) | 14.0% | 9.6% |
| Interquartile Range (IQR) | 7.5% | 3.6% |
| Standard Deviation (Sample) | 5.4% | 4.2% |
| Standard Deviation (Population) | 5.4% | 4.1% |
Similar Demographics by Single Mother Households
Demographics Similar to Inupiat by Single Mother Households
In terms of single mother households, the demographic groups most similar to Inupiat are Sioux (8.5%, a difference of 0.0%), Hopi (8.5%, a difference of 0.11%), Yakama (8.4%, a difference of 0.85%), Immigrants from Haiti (8.4%, a difference of 1.0%), and British West Indian (8.4%, a difference of 1.2%).
| Demographics | Rating | Rank | Single Mother Households |
| Haitians | 0.0 /100 | #323 | Tragic 8.3% |
| Immigrants | Jamaica | 0.0 /100 | #324 | Tragic 8.4% |
| Immigrants | Caribbean | 0.0 /100 | #325 | Tragic 8.4% |
| British West Indians | 0.0 /100 | #326 | Tragic 8.4% |
| Immigrants | Haiti | 0.0 /100 | #327 | Tragic 8.4% |
| Yakama | 0.0 /100 | #328 | Tragic 8.4% |
| Hopi | 0.0 /100 | #329 | Tragic 8.5% |
| Inupiat | 0.0 /100 | #330 | Tragic 8.5% |
| Sioux | 0.0 /100 | #331 | Tragic 8.5% |
| U.S. Virgin Islanders | 0.0 /100 | #332 | Tragic 8.6% |
| Liberians | 0.0 /100 | #333 | Tragic 8.6% |
| Immigrants | Liberia | 0.0 /100 | #334 | Tragic 8.7% |
| Immigrants | Dominica | 0.0 /100 | #335 | Tragic 8.7% |
| Puerto Ricans | 0.0 /100 | #336 | Tragic 8.7% |
| Navajo | 0.0 /100 | #337 | Tragic 8.8% |
Demographics Similar to Central American Indians by Single Mother Households
In terms of single mother households, the demographic groups most similar to Central American Indians are Immigrants from Guyana (7.6%, a difference of 0.10%), Belizean (7.6%, a difference of 0.14%), Immigrants from the Azores (7.5%, a difference of 0.45%), Guyanese (7.6%, a difference of 0.45%), and Salvadoran (7.5%, a difference of 0.46%).
| Demographics | Rating | Rank | Single Mother Households |
| Indonesians | 0.1 /100 | #268 | Tragic 7.5% |
| Somalis | 0.1 /100 | #269 | Tragic 7.5% |
| Immigrants | Cuba | 0.1 /100 | #270 | Tragic 7.5% |
| Salvadorans | 0.1 /100 | #271 | Tragic 7.5% |
| Immigrants | Azores | 0.1 /100 | #272 | Tragic 7.5% |
| Belizeans | 0.1 /100 | #273 | Tragic 7.6% |
| Immigrants | Guyana | 0.1 /100 | #274 | Tragic 7.6% |
| Central American Indians | 0.1 /100 | #275 | Tragic 7.6% |
| Guyanese | 0.1 /100 | #276 | Tragic 7.6% |
| Immigrants | Trinidad and Tobago | 0.1 /100 | #277 | Tragic 7.6% |
| Central Americans | 0.1 /100 | #278 | Tragic 7.6% |
| Immigrants | El Salvador | 0.0 /100 | #279 | Tragic 7.6% |
| Immigrants | Sierra Leone | 0.0 /100 | #280 | Tragic 7.7% |
| Immigrants | Laos | 0.0 /100 | #281 | Tragic 7.7% |
| Guatemalans | 0.0 /100 | #282 | Tragic 7.7% |