Indian (Asian) vs Immigrants from Sudan Single Mother Households

COMPARE

Indian (Asian)
Race
Ancestry
AfghanAfricanAlaska NativeAlaskan AthabascanAlbanianAleutAlsatianAmericanApacheArabArapahoArgentineanArmenianAssyrian/Chaldean/SyriacAustralianAustrianBahamianBangladeshiBarbadianBasqueBelgianBelizeanBermudanBhutaneseBlackfeetBolivianBrazilianBritishBritish West IndianBulgarianBurmeseCajunCambodianCanadianCape VerdeanCarpatho RusynCelticCentral AmericanCentral American IndianCherokeeCheyenneChickasawChileanChineseChippewaChoctawColombianColvilleComancheCosta RicanCreeCreekCroatianCrowCubanCypriotCzechCzechoslovakianDanishDelawareDominicanDutchDutch West IndianEastern EuropeanEcuadorianEgyptianEnglishEstonianEthiopianEuropeanFijianFilipinoFinnishFrenchFrench American IndianFrench CanadianGermanGerman RussianGhanaianGreekGuamanian/ChamorroGuatemalanGuyaneseHaitianHmongHonduranHopiHoumaHungarianIcelanderIndian (Asian)IndonesianInupiatIranianIraqiIrishIroquoisIsraeliItalianJamaicanJapaneseJordanianKenyanKiowaKoreanLaotianLatvianLebaneseLiberianLithuanianLumbeeLuxembourgerMacedonianMalaysianMalteseMarshalleseMenomineeMexicanMexican American IndianMongolianMoroccanNative HawaiianNavajoNepaleseNew ZealanderNicaraguanNigerianNorthern EuropeanNorwegianOkinawanOsageOttawaPaiutePakistaniPalestinianPanamanianParaguayanPennsylvania GermanPeruvianPimaPolishPortuguesePotawatomiPuebloPuerto RicanPuget Sound SalishRomanianRussianSalvadoranSamoanScandinavianScotch-IrishScottishSeminoleSenegaleseSerbianShoshoneSierra LeoneanSiouxSlavicSlovakSloveneSomaliSouth AfricanSouth AmericanSouth American IndianSoviet UnionSpaniardSpanishSpanish AmericanSpanish American IndianSri LankanSubsaharan AfricanSudaneseSwedishSwissSyrianTaiwaneseThaiTlingit-HaidaTohono O'OdhamTonganTrinidadian and TobagonianTsimshianTurkishU.S. Virgin IslanderUgandanUkrainianUruguayanUteVenezuelanVietnameseWelshWest IndianYakamaYaquiYugoslavianYumanYup'ikZimbabwean
Immigration
NonimmigrantsImmigrantsAfghanistanAfricaAlbaniaArgentinaArmeniaAsiaAustraliaAustriaBahamasBangladeshBarbadosBelarusBelgiumBelizeBoliviaBosnia and HerzegovinaBrazilBulgariaBurma/MyanmarCabo VerdeCambodiaCameroonCanadaCaribbeanCentral AmericaChileChinaColombiaCongoCosta RicaCroatiaCubaCzechoslovakiaDenmarkDominicaDominican RepublicEastern AfricaEastern AsiaEastern EuropeEcuadorEgyptEl SalvadorEnglandEritreaEthiopiaEuropeFijiFranceGermanyGhanaGreeceGrenadaGuatemalaGuyanaHaitiHondurasHong KongHungaryIndiaIndonesiaIranIraqIrelandIsraelItalyJamaicaJapanJordanKazakhstanKenyaKoreaKuwaitLaosLatin AmericaLatviaLebanonLiberiaLithuaniaMalaysiaMexicoMicronesiaMiddle AfricaMoldovaMoroccoNepalNetherlandsNicaraguaNigeriaNorth AmericaNorth MacedoniaNorthern AfricaNorthern EuropeNorwayOceaniaPakistanPanamaPeruPhilippinesPolandPortugalRomaniaRussiaSaudi ArabiaScotlandSenegalSerbiaSierra LeoneSingaporeSomaliaSouth AfricaSouth AmericaSouth Central AsiaSouth Eastern AsiaSouthern EuropeSpainSri LankaSt. Vincent and the GrenadinesSwedenSwitzerlandSyriaTaiwanThailandTrinidad and TobagoTurkeyUgandaUkraineUruguayUzbekistanVenezuelaVietnamWest IndiesWestern AfricaWestern AsiaWestern EuropeYemenZaireZimbabweAzores
Immigrants from Sudan
Race
Ancestry
AfghanAfricanAlaska NativeAlaskan AthabascanAlbanianAleutAlsatianAmericanApacheArabArapahoArgentineanArmenianAssyrian/Chaldean/SyriacAustralianAustrianBahamianBangladeshiBarbadianBasqueBelgianBelizeanBermudanBhutaneseBlackfeetBolivianBrazilianBritishBritish West IndianBulgarianBurmeseCajunCambodianCanadianCape VerdeanCarpatho RusynCelticCentral AmericanCentral American IndianCherokeeCheyenneChickasawChileanChineseChippewaChoctawColombianColvilleComancheCosta RicanCreeCreekCroatianCrowCubanCypriotCzechCzechoslovakianDanishDelawareDominicanDutchDutch West IndianEastern EuropeanEcuadorianEgyptianEnglishEstonianEthiopianEuropeanFijianFilipinoFinnishFrenchFrench American IndianFrench CanadianGermanGerman RussianGhanaianGreekGuamanian/ChamorroGuatemalanGuyaneseHaitianHmongHonduranHopiHoumaHungarianIcelanderIndonesianInupiatIranianIraqiIrishIroquoisIsraeliItalianJamaicanJapaneseJordanianKenyanKiowaKoreanLaotianLatvianLebaneseLiberianLithuanianLumbeeLuxembourgerMacedonianMalaysianMalteseMarshalleseMenomineeMexicanMexican American IndianMongolianMoroccanNative HawaiianNavajoNepaleseNew ZealanderNicaraguanNigerianNorthern EuropeanNorwegianOkinawanOsageOttawaPaiutePakistaniPalestinianPanamanianParaguayanPennsylvania GermanPeruvianPimaPolishPortuguesePotawatomiPuebloPuerto RicanPuget Sound SalishRomanianRussianSalvadoranSamoanScandinavianScotch-IrishScottishSeminoleSenegaleseSerbianShoshoneSierra LeoneanSiouxSlavicSlovakSloveneSomaliSouth AfricanSouth AmericanSouth American IndianSoviet UnionSpaniardSpanishSpanish AmericanSpanish American IndianSri LankanSubsaharan AfricanSudaneseSwedishSwissSyrianTaiwaneseThaiTlingit-HaidaTohono O'OdhamTonganTrinidadian and TobagonianTsimshianTurkishU.S. Virgin IslanderUgandanUkrainianUruguayanUteVenezuelanVietnameseWelshWest IndianYakamaYaquiYugoslavianYumanYup'ikZimbabwean
Immigration
NonimmigrantsImmigrantsAfghanistanAfricaAlbaniaArgentinaArmeniaAsiaAustraliaAustriaBahamasBangladeshBarbadosBelarusBelgiumBelizeBoliviaBosnia and HerzegovinaBrazilBulgariaBurma/MyanmarCabo VerdeCambodiaCameroonCanadaCaribbeanCentral AmericaChileChinaColombiaCongoCosta RicaCroatiaCubaCzechoslovakiaDenmarkDominicaDominican RepublicEastern AfricaEastern AsiaEastern EuropeEcuadorEgyptEl SalvadorEnglandEritreaEthiopiaEuropeFijiFranceGermanyGhanaGreeceGrenadaGuatemalaGuyanaHaitiHondurasHong KongHungaryIndiaIndonesiaIranIraqIrelandIsraelItalyJamaicaJapanJordanKazakhstanKenyaKoreaKuwaitLaosLatin AmericaLatviaLebanonLiberiaLithuaniaMalaysiaMexicoMicronesiaMiddle AfricaMoldovaMoroccoNepalNetherlandsNicaraguaNigeriaNorth AmericaNorth MacedoniaNorthern AfricaNorthern EuropeNorwayOceaniaPakistanPanamaPeruPhilippinesPolandPortugalRomaniaRussiaSaudi ArabiaScotlandSenegalSerbiaSierra LeoneSingaporeSomaliaSouth AfricaSouth AmericaSouth Central AsiaSouth Eastern AsiaSouthern EuropeSpainSri LankaSt. Vincent and the GrenadinesSudanSwedenSwitzerlandSyriaTaiwanThailandTrinidad and TobagoTurkeyUgandaUkraineUruguayUzbekistanVenezuelaVietnamWest IndiesWestern AfricaWestern AsiaWestern EuropeYemenZaireZimbabweAzores
Single Mother Households
Income
Poverty
Unemployment
Labor Participation
Family Structure
Vehicle Availability
Education Level
Disability

Single Mother Households Comparison

Indians (Asian)

Immigrants from Sudan

Exceptional
Tragic
5.1%
SINGLE MOTHER HOUSEHOLDS
99.9/ 100
METRIC RATING
16th/ 347
METRIC RANK
6.9%
SINGLE MOTHER HOUSEHOLDS
3.5/ 100
METRIC RATING
224th/ 347
METRIC RANK

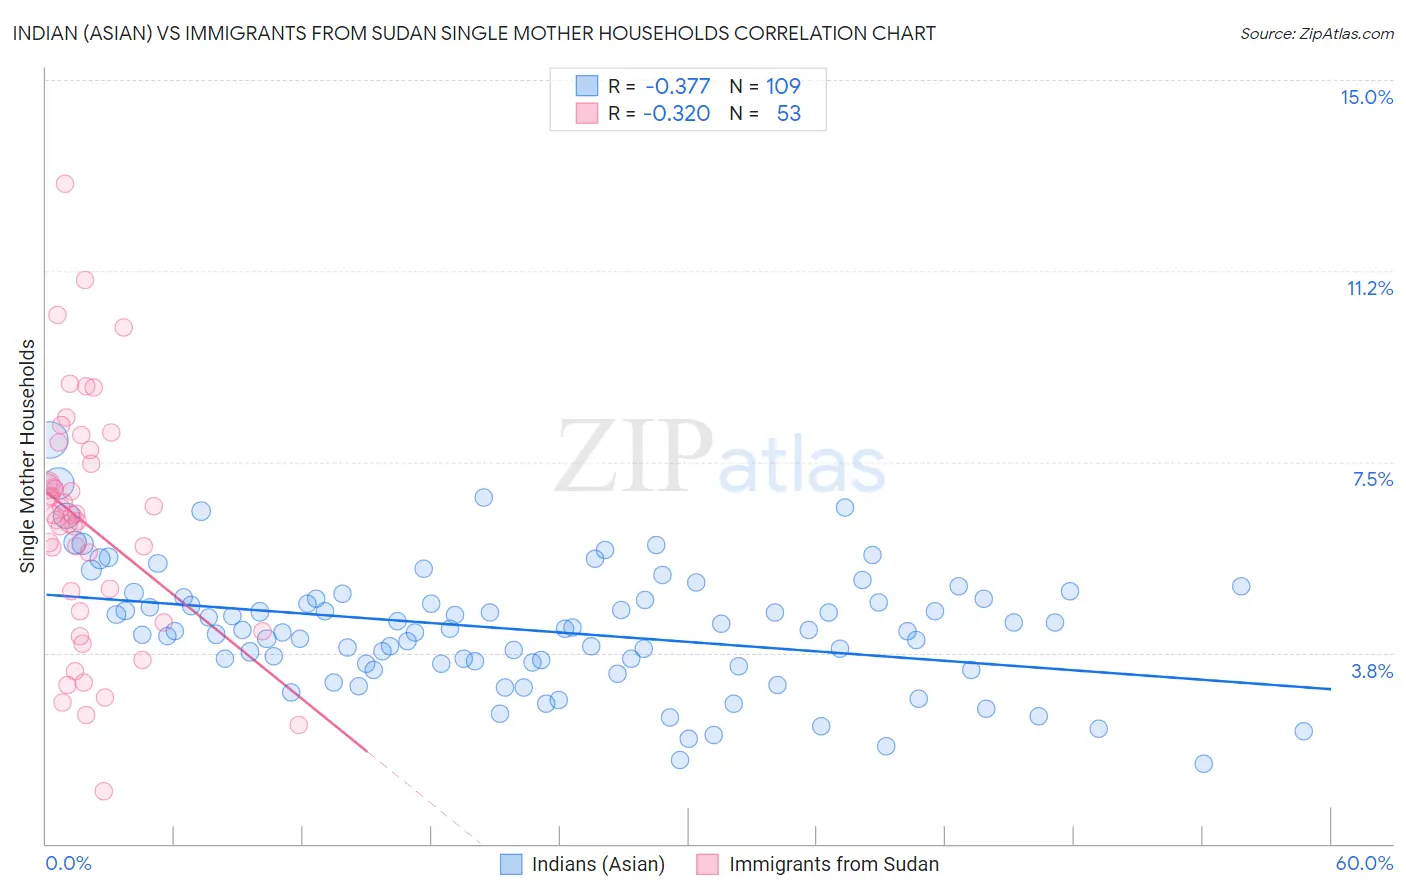
Indian (Asian) vs Immigrants from Sudan Single Mother Households Correlation Chart

The statistical analysis conducted on geographies consisting of 492,899,997 people shows a mild negative correlation between the proportion of Indians (Asian) and percentage of single mother households in the United States with a correlation coefficient (R) of -0.377 and weighted average of 5.1%. Similarly, the statistical analysis conducted on geographies consisting of 118,904,005 people shows a mild negative correlation between the proportion of Immigrants from Sudan and percentage of single mother households in the United States with a correlation coefficient (R) of -0.320 and weighted average of 6.9%, a difference of 34.8%.
Indian (Asian) vs Immigrants from Sudan Single Mother Households

Single Mother Households Correlation Summary

MeasurementIndian (Asian)Immigrants from Sudan
Minimum1.6%1.0%
Maximum7.9%13.0%
Range6.4%11.9%
Mean4.2%6.3%
Median4.2%6.5%
Interquartile 25% (IQ1)3.5%4.5%
Interquartile 75% (IQ3)4.8%7.6%
Interquartile Range (IQR)1.3%3.1%
Standard Deviation (Sample)1.2%2.4%
Standard Deviation (Population)1.2%2.3%

Similar Demographics by Single Mother Households

Demographics Similar to Indians (Asian) by Single Mother Households

In terms of single mother households, the demographic groups most similar to Indians (Asian) are Immigrants from Eastern Asia (5.1%, a difference of 0.19%), Soviet Union (5.1%, a difference of 0.21%), Immigrants from Australia (5.1%, a difference of 0.28%), Immigrants from India (5.1%, a difference of 0.60%), and Cypriot (5.1%, a difference of 0.73%).
DemographicsRating | RankSingle Mother Households
Okinawans
99.9
/100
|
#9
Exceptional
5.0%
Immigrants | Israel
99.9
/100
|
#10
Exceptional
5.0%
Immigrants | China
99.9
/100
|
#11
Exceptional
5.1%
Cypriots
99.9
/100
|
#12
Exceptional
5.1%
Immigrants | India
99.9
/100
|
#13
Exceptional
5.1%
Immigrants | Australia
99.9
/100
|
#14
Exceptional
5.1%
Immigrants | Eastern Asia
99.9
/100
|
#15
Exceptional
5.1%
Indians (Asian)
99.9
/100
|
#16
Exceptional
5.1%
Soviet Union
99.9
/100
|
#17
Exceptional
5.1%
Immigrants | Armenia
99.9
/100
|
#18
Exceptional
5.2%
Chinese
99.9
/100
|
#19
Exceptional
5.2%
Maltese
99.9
/100
|
#20
Exceptional
5.2%
Eastern Europeans
99.8
/100
|
#21
Exceptional
5.2%
Thais
99.8
/100
|
#22
Exceptional
5.2%
Immigrants | Austria
99.8
/100
|
#23
Exceptional
5.2%

Demographics Similar to Immigrants from Sudan by Single Mother Households

In terms of single mother households, the demographic groups most similar to Immigrants from Sudan are Immigrants from Micronesia (6.9%, a difference of 0.12%), Immigrants from Bangladesh (6.9%, a difference of 0.17%), French American Indian (6.9%, a difference of 0.19%), Sudanese (6.9%, a difference of 0.27%), and Immigrants from Thailand (6.9%, a difference of 0.39%).
DemographicsRating | RankSingle Mother Households
Aleuts
4.8
/100
|
#217
Tragic
6.8%
Immigrants | Eastern Africa
4.4
/100
|
#218
Tragic
6.8%
Immigrants | Immigrants
4.3
/100
|
#219
Tragic
6.8%
Immigrants | Thailand
4.0
/100
|
#220
Tragic
6.9%
French American Indians
3.7
/100
|
#221
Tragic
6.9%
Immigrants | Bangladesh
3.7
/100
|
#222
Tragic
6.9%
Immigrants | Micronesia
3.6
/100
|
#223
Tragic
6.9%
Immigrants | Sudan
3.5
/100
|
#224
Tragic
6.9%
Sudanese
3.1
/100
|
#225
Tragic
6.9%
Paiute
2.4
/100
|
#226
Tragic
7.0%
Kenyans
2.3
/100
|
#227
Tragic
7.0%
Iroquois
2.2
/100
|
#228
Tragic
7.0%
Immigrants | Kenya
2.1
/100
|
#229
Tragic
7.0%
Creek
1.6
/100
|
#230
Tragic
7.0%
Spanish Americans
1.6
/100
|
#231
Tragic
7.0%