Indian (Asian) vs Fijian Divorced or Separated
COMPARE
Indian (Asian)
Fijian
Divorced or Separated
Divorced or Separated Comparison
Indians (Asian)
Fijians
10.2%
DIVORCED OR SEPARATED
100.0/ 100
METRIC RATING
6th/ 347
METRIC RANK
12.6%
DIVORCED OR SEPARATED
0.4/ 100
METRIC RATING
268th/ 347
METRIC RANK
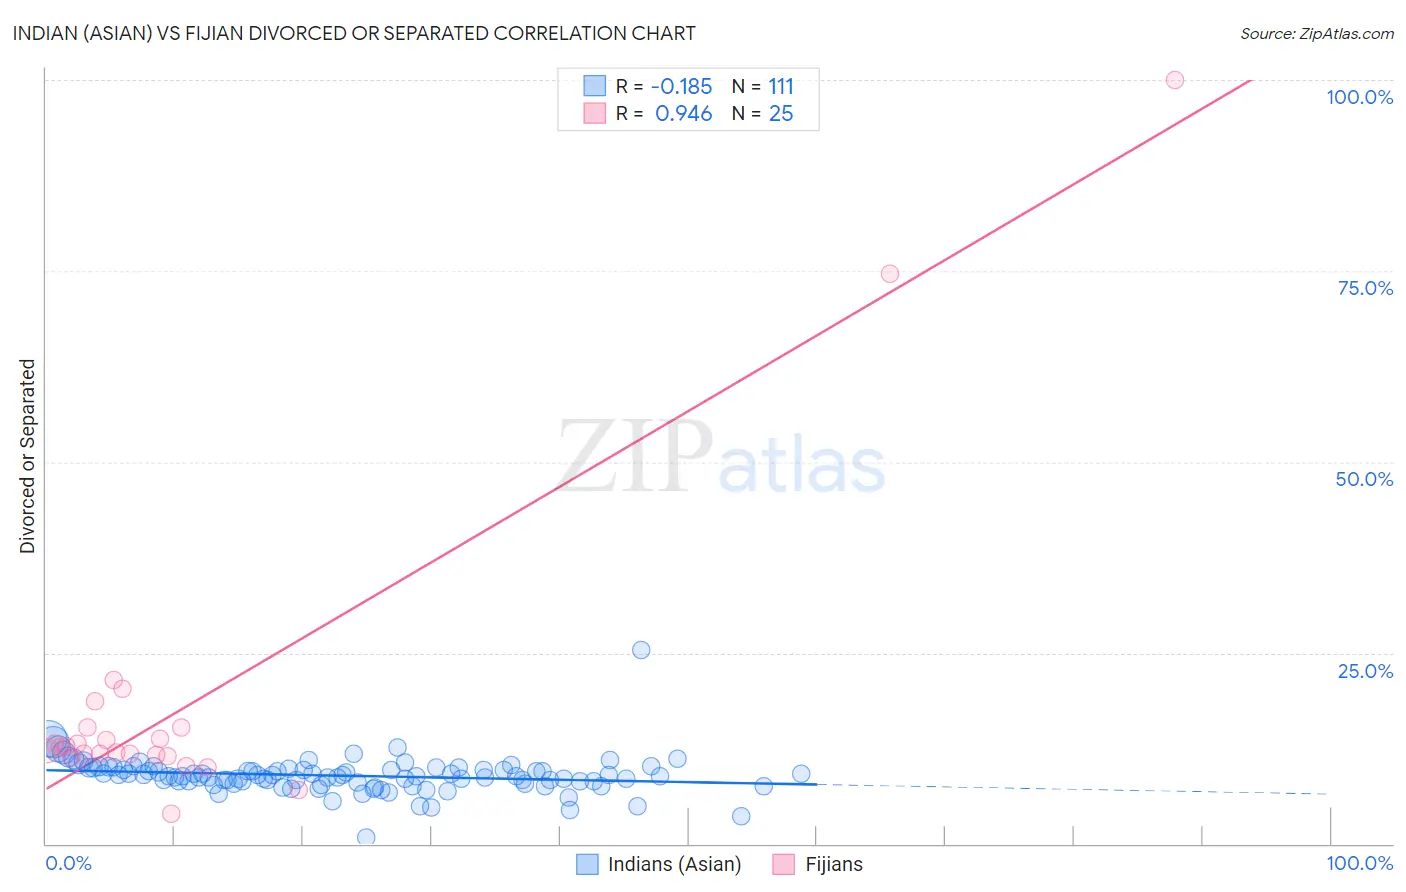
Indian (Asian) vs Fijian Divorced or Separated Correlation Chart
The statistical analysis conducted on geographies consisting of 494,939,587 people shows a poor negative correlation between the proportion of Indians (Asian) and percentage of population currently divorced or separated in the United States with a correlation coefficient (R) of -0.185 and weighted average of 10.2%. Similarly, the statistical analysis conducted on geographies consisting of 55,948,408 people shows a near-perfect positive correlation between the proportion of Fijians and percentage of population currently divorced or separated in the United States with a correlation coefficient (R) of 0.946 and weighted average of 12.6%, a difference of 23.8%.
Divorced or Separated Correlation Summary
| Measurement | Indian (Asian) | Fijian |
| Minimum | 0.80% | 4.0% |
| Maximum | 25.4% | 100.0% |
| Range | 24.6% | 96.0% |
| Mean | 8.9% | 18.8% |
| Median | 8.8% | 12.6% |
| Interquartile 25% (IQ1) | 8.0% | 11.6% |
| Interquartile 75% (IQ3) | 9.8% | 15.3% |
| Interquartile Range (IQR) | 1.8% | 3.7% |
| Standard Deviation (Sample) | 2.4% | 21.3% |
| Standard Deviation (Population) | 2.4% | 20.8% |
Similar Demographics by Divorced or Separated
Demographics Similar to Indians (Asian) by Divorced or Separated
In terms of divorced or separated, the demographic groups most similar to Indians (Asian) are Thai (10.2%, a difference of 0.050%), Immigrants from Eastern Asia (10.2%, a difference of 0.39%), Yup'ik (10.3%, a difference of 0.83%), Immigrants from India (10.1%, a difference of 1.3%), and Immigrants from Singapore (10.3%, a difference of 1.4%).
| Demographics | Rating | Rank | Divorced or Separated |
| Immigrants | Taiwan | 100.0 /100 | #1 | Exceptional 9.8% |
| Filipinos | 100.0 /100 | #2 | Exceptional 9.9% |
| Immigrants | Hong Kong | 100.0 /100 | #3 | Exceptional 10.0% |
| Immigrants | China | 100.0 /100 | #4 | Exceptional 10.0% |
| Immigrants | India | 100.0 /100 | #5 | Exceptional 10.1% |
| Indians (Asian) | 100.0 /100 | #6 | Exceptional 10.2% |
| Thais | 100.0 /100 | #7 | Exceptional 10.2% |
| Immigrants | Eastern Asia | 100.0 /100 | #8 | Exceptional 10.2% |
| Yup'ik | 100.0 /100 | #9 | Exceptional 10.3% |
| Immigrants | Singapore | 100.0 /100 | #10 | Exceptional 10.3% |
| Immigrants | South Central Asia | 100.0 /100 | #11 | Exceptional 10.4% |
| Okinawans | 100.0 /100 | #12 | Exceptional 10.5% |
| Cypriots | 100.0 /100 | #13 | Exceptional 10.5% |
| Assyrians/Chaldeans/Syriacs | 100.0 /100 | #14 | Exceptional 10.6% |
| Immigrants | Armenia | 100.0 /100 | #15 | Exceptional 10.6% |
Demographics Similar to Fijians by Divorced or Separated
In terms of divorced or separated, the demographic groups most similar to Fijians are Scottish (12.6%, a difference of 0.010%), Immigrants from Liberia (12.6%, a difference of 0.010%), White/Caucasian (12.6%, a difference of 0.060%), Immigrants from Senegal (12.6%, a difference of 0.070%), and English (12.6%, a difference of 0.080%).
| Demographics | Rating | Rank | Divorced or Separated |
| Immigrants | Dominica | 0.5 /100 | #261 | Tragic 12.6% |
| Basques | 0.5 /100 | #262 | Tragic 12.6% |
| Immigrants | Panama | 0.5 /100 | #263 | Tragic 12.6% |
| English | 0.5 /100 | #264 | Tragic 12.6% |
| Immigrants | Senegal | 0.5 /100 | #265 | Tragic 12.6% |
| Whites/Caucasians | 0.5 /100 | #266 | Tragic 12.6% |
| Scottish | 0.4 /100 | #267 | Tragic 12.6% |
| Fijians | 0.4 /100 | #268 | Tragic 12.6% |
| Immigrants | Liberia | 0.4 /100 | #269 | Tragic 12.6% |
| Ute | 0.4 /100 | #270 | Tragic 12.6% |
| Panamanians | 0.3 /100 | #271 | Tragic 12.7% |
| Immigrants | Middle Africa | 0.3 /100 | #272 | Tragic 12.7% |
| Immigrants | Micronesia | 0.3 /100 | #273 | Tragic 12.7% |
| Bermudans | 0.3 /100 | #274 | Tragic 12.7% |
| Central American Indians | 0.3 /100 | #275 | Tragic 12.7% |