Immigrants from Zimbabwe vs American Divorced or Separated

COMPARE

Immigrants from Zimbabwe
Race
Ancestry
AfghanAfricanAlaska NativeAlaskan AthabascanAlbanianAleutAlsatianApacheArabArapahoArgentineanArmenianAssyrian/Chaldean/SyriacAustralianAustrianBahamianBangladeshiBarbadianBasqueBelgianBelizeanBermudanBhutaneseBlackfeetBolivianBrazilianBritishBritish West IndianBulgarianBurmeseCajunCambodianCanadianCape VerdeanCarpatho RusynCelticCentral AmericanCentral American IndianCherokeeCheyenneChickasawChileanChineseChippewaChoctawColombianColvilleComancheCosta RicanCreeCreekCroatianCrowCubanCypriotCzechCzechoslovakianDanishDelawareDominicanDutchDutch West IndianEastern EuropeanEcuadorianEgyptianEnglishEstonianEthiopianEuropeanFijianFilipinoFinnishFrenchFrench American IndianFrench CanadianGermanGerman RussianGhanaianGreekGuamanian/ChamorroGuatemalanGuyaneseHaitianHmongHonduranHopiHoumaHungarianIcelanderIndian (Asian)IndonesianInupiatIranianIraqiIrishIroquoisIsraeliItalianJamaicanJapaneseJordanianKenyanKiowaKoreanLaotianLatvianLebaneseLiberianLithuanianLumbeeLuxembourgerMacedonianMalaysianMalteseMarshalleseMenomineeMexicanMexican American IndianMongolianMoroccanNative HawaiianNavajoNepaleseNew ZealanderNicaraguanNigerianNorthern EuropeanNorwegianOkinawanOsageOttawaPaiutePakistaniPalestinianPanamanianParaguayanPennsylvania GermanPeruvianPimaPolishPortuguesePotawatomiPuebloPuerto RicanPuget Sound SalishRomanianRussianSalvadoranSamoanScandinavianScotch-IrishScottishSeminoleSenegaleseSerbianShoshoneSierra LeoneanSiouxSlavicSlovakSloveneSomaliSouth AfricanSouth AmericanSouth American IndianSoviet UnionSpaniardSpanishSpanish AmericanSpanish American IndianSri LankanSubsaharan AfricanSudaneseSwedishSwissSyrianTaiwaneseThaiTlingit-HaidaTohono O'OdhamTonganTrinidadian and TobagonianTsimshianTurkishU.S. Virgin IslanderUgandanUkrainianUruguayanUteVenezuelanVietnameseWelshWest IndianYakamaYaquiYugoslavianYumanYup'ikZimbabwean
Immigration
NonimmigrantsImmigrantsAfghanistanAfricaAlbaniaArgentinaArmeniaAsiaAustraliaAustriaBahamasBangladeshBarbadosBelarusBelgiumBelizeBoliviaBosnia and HerzegovinaBrazilBulgariaBurma/MyanmarCabo VerdeCambodiaCameroonCanadaCaribbeanCentral AmericaChileChinaColombiaCongoCosta RicaCroatiaCubaCzechoslovakiaDenmarkDominicaDominican RepublicEastern AfricaEastern AsiaEastern EuropeEcuadorEgyptEl SalvadorEnglandEritreaEthiopiaEuropeFijiFranceGermanyGhanaGreeceGrenadaGuatemalaGuyanaHaitiHondurasHong KongHungaryIndiaIndonesiaIranIraqIrelandIsraelItalyJamaicaJapanJordanKazakhstanKenyaKoreaKuwaitLaosLatin AmericaLatviaLebanonLiberiaLithuaniaMalaysiaMexicoMicronesiaMiddle AfricaMoldovaMoroccoNepalNetherlandsNicaraguaNigeriaNorth AmericaNorth MacedoniaNorthern AfricaNorthern EuropeNorwayOceaniaPakistanPanamaPeruPhilippinesPolandPortugalRomaniaRussiaSaudi ArabiaScotlandSenegalSerbiaSierra LeoneSingaporeSomaliaSouth AfricaSouth AmericaSouth Central AsiaSouth Eastern AsiaSouthern EuropeSpainSri LankaSt. Vincent and the GrenadinesSudanSwedenSwitzerlandSyriaTaiwanThailandTrinidad and TobagoTurkeyUgandaUkraineUruguayUzbekistanVenezuelaVietnamWest IndiesWestern AfricaWestern AsiaWestern EuropeYemenZaireZimbabweAzores
American
Race
Ancestry
AfghanAfricanAlaska NativeAlaskan AthabascanAlbanianAleutAlsatianAmericanApacheArabArapahoArgentineanArmenianAssyrian/Chaldean/SyriacAustralianAustrianBahamianBangladeshiBarbadianBasqueBelgianBelizeanBermudanBhutaneseBlackfeetBolivianBrazilianBritishBritish West IndianBulgarianBurmeseCajunCambodianCanadianCape VerdeanCarpatho RusynCelticCentral AmericanCentral American IndianCherokeeCheyenneChickasawChileanChineseChippewaChoctawColombianColvilleComancheCosta RicanCreeCreekCroatianCrowCubanCypriotCzechCzechoslovakianDanishDelawareDominicanDutchDutch West IndianEastern EuropeanEcuadorianEgyptianEnglishEstonianEthiopianEuropeanFijianFilipinoFinnishFrenchFrench American IndianFrench CanadianGermanGerman RussianGhanaianGreekGuamanian/ChamorroGuatemalanGuyaneseHaitianHmongHonduranHopiHoumaHungarianIcelanderIndian (Asian)IndonesianInupiatIranianIraqiIrishIroquoisIsraeliItalianJamaicanJapaneseJordanianKenyanKiowaKoreanLaotianLatvianLebaneseLiberianLithuanianLumbeeLuxembourgerMacedonianMalaysianMalteseMarshalleseMenomineeMexicanMexican American IndianMongolianMoroccanNative HawaiianNavajoNepaleseNew ZealanderNicaraguanNigerianNorthern EuropeanNorwegianOkinawanOsageOttawaPaiutePakistaniPalestinianPanamanianParaguayanPennsylvania GermanPeruvianPimaPolishPortuguesePotawatomiPuebloPuerto RicanPuget Sound SalishRomanianRussianSalvadoranSamoanScandinavianScotch-IrishScottishSeminoleSenegaleseSerbianShoshoneSierra LeoneanSiouxSlavicSlovakSloveneSomaliSouth AfricanSouth AmericanSouth American IndianSoviet UnionSpaniardSpanishSpanish AmericanSpanish American IndianSri LankanSubsaharan AfricanSudaneseSwedishSwissSyrianTaiwaneseThaiTlingit-HaidaTohono O'OdhamTonganTrinidadian and TobagonianTsimshianTurkishU.S. Virgin IslanderUgandanUkrainianUruguayanUteVenezuelanVietnameseWelshWest IndianYakamaYaquiYugoslavianYumanYup'ikZimbabwean
Immigration
NonimmigrantsImmigrantsAfghanistanAfricaAlbaniaArgentinaArmeniaAsiaAustraliaAustriaBahamasBangladeshBarbadosBelarusBelgiumBelizeBoliviaBosnia and HerzegovinaBrazilBulgariaBurma/MyanmarCabo VerdeCambodiaCameroonCanadaCaribbeanCentral AmericaChileChinaColombiaCongoCosta RicaCroatiaCubaCzechoslovakiaDenmarkDominicaDominican RepublicEastern AfricaEastern AsiaEastern EuropeEcuadorEgyptEl SalvadorEnglandEritreaEthiopiaEuropeFijiFranceGermanyGhanaGreeceGrenadaGuatemalaGuyanaHaitiHondurasHong KongHungaryIndiaIndonesiaIranIraqIrelandIsraelItalyJamaicaJapanJordanKazakhstanKenyaKoreaKuwaitLaosLatin AmericaLatviaLebanonLiberiaLithuaniaMalaysiaMexicoMicronesiaMiddle AfricaMoldovaMoroccoNepalNetherlandsNicaraguaNigeriaNorth AmericaNorth MacedoniaNorthern AfricaNorthern EuropeNorwayOceaniaPakistanPanamaPeruPhilippinesPolandPortugalRomaniaRussiaSaudi ArabiaScotlandSenegalSerbiaSierra LeoneSingaporeSomaliaSouth AfricaSouth AmericaSouth Central AsiaSouth Eastern AsiaSouthern EuropeSpainSri LankaSt. Vincent and the GrenadinesSudanSwedenSwitzerlandSyriaTaiwanThailandTrinidad and TobagoTurkeyUgandaUkraineUruguayUzbekistanVenezuelaVietnamWest IndiesWestern AfricaWestern AsiaWestern EuropeYemenZaireAzores
Divorced or Separated
Income
Poverty
Unemployment
Labor Participation
Family Structure
Vehicle Availability
Education Level
Disability

Divorced or Separated Comparison

Immigrants from Zimbabwe

Americans

Excellent
Tragic
11.9%
DIVORCED OR SEPARATED
81.5/ 100
METRIC RATING
142nd/ 347
METRIC RANK
13.2%
DIVORCED OR SEPARATED
0.0/ 100
METRIC RATING
309th/ 347
METRIC RANK

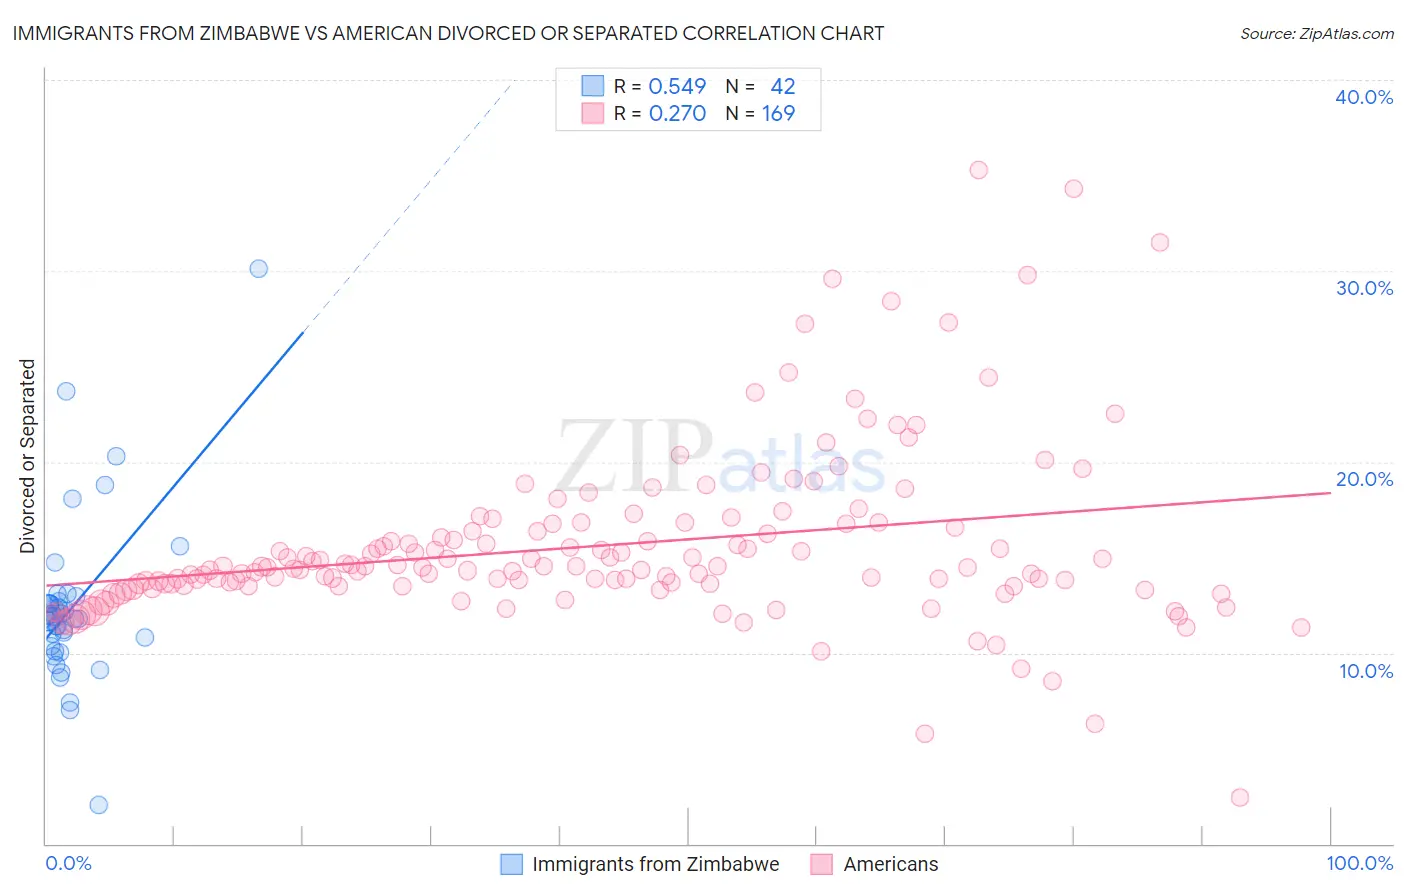
Immigrants from Zimbabwe vs American Divorced or Separated Correlation Chart

The statistical analysis conducted on geographies consisting of 117,798,531 people shows a substantial positive correlation between the proportion of Immigrants from Zimbabwe and percentage of population currently divorced or separated in the United States with a correlation coefficient (R) of 0.549 and weighted average of 11.9%. Similarly, the statistical analysis conducted on geographies consisting of 581,440,230 people shows a weak positive correlation between the proportion of Americans and percentage of population currently divorced or separated in the United States with a correlation coefficient (R) of 0.270 and weighted average of 13.2%, a difference of 11.2%.
Immigrants from Zimbabwe vs American Divorced or Separated

Divorced or Separated Correlation Summary

MeasurementImmigrants from ZimbabweAmerican
Minimum2.0%2.4%
Maximum30.1%35.3%
Range28.1%32.9%
Mean12.4%15.6%
Median11.9%14.5%
Interquartile 25% (IQ1)10.4%13.5%
Interquartile 75% (IQ3)12.7%16.6%
Interquartile Range (IQR)2.4%3.1%
Standard Deviation (Sample)4.5%4.6%
Standard Deviation (Population)4.5%4.6%

Similar Demographics by Divorced or Separated

Demographics Similar to Immigrants from Zimbabwe by Divorced or Separated

In terms of divorced or separated, the demographic groups most similar to Immigrants from Zimbabwe are Pakistani (11.9%, a difference of 0.010%), Peruvian (11.9%, a difference of 0.030%), Croatian (11.9%, a difference of 0.050%), Immigrants from Morocco (11.9%, a difference of 0.090%), and Lebanese (11.9%, a difference of 0.12%).
DemographicsRating | RankDivorced or Separated
Danes
84.8
/100
|
#135
Excellent
11.9%
Carpatho Rusyns
84.8
/100
|
#136
Excellent
11.9%
Alsatians
84.0
/100
|
#137
Excellent
11.9%
Immigrants | Netherlands
83.9
/100
|
#138
Excellent
11.9%
Australians
83.6
/100
|
#139
Excellent
11.9%
Lebanese
83.4
/100
|
#140
Excellent
11.9%
Immigrants | Morocco
82.9
/100
|
#141
Excellent
11.9%
Immigrants | Zimbabwe
81.5
/100
|
#142
Excellent
11.9%
Pakistanis
81.3
/100
|
#143
Excellent
11.9%
Peruvians
80.9
/100
|
#144
Excellent
11.9%
Croatians
80.6
/100
|
#145
Excellent
11.9%
Immigrants | Grenada
79.1
/100
|
#146
Good
11.9%
Poles
78.6
/100
|
#147
Good
11.9%
Italians
77.8
/100
|
#148
Good
11.9%
Immigrants | Oceania
77.7
/100
|
#149
Good
11.9%

Demographics Similar to Americans by Divorced or Separated

In terms of divorced or separated, the demographic groups most similar to Americans are Ottawa (13.2%, a difference of 0.010%), African (13.2%, a difference of 0.020%), Sioux (13.2%, a difference of 0.040%), French American Indian (13.2%, a difference of 0.10%), and Tlingit-Haida (13.2%, a difference of 0.35%).
DemographicsRating | RankDivorced or Separated
Immigrants | Venezuela
0.0
/100
|
#302
Tragic
13.1%
Cape Verdeans
0.0
/100
|
#303
Tragic
13.1%
Hopi
0.0
/100
|
#304
Tragic
13.2%
Chippewa
0.0
/100
|
#305
Tragic
13.2%
Tlingit-Haida
0.0
/100
|
#306
Tragic
13.2%
French American Indians
0.0
/100
|
#307
Tragic
13.2%
Ottawa
0.0
/100
|
#308
Tragic
13.2%
Americans
0.0
/100
|
#309
Tragic
13.2%
Africans
0.0
/100
|
#310
Tragic
13.2%
Sioux
0.0
/100
|
#311
Tragic
13.2%
Blackfeet
0.0
/100
|
#312
Tragic
13.3%
Immigrants | Nicaragua
0.0
/100
|
#313
Tragic
13.3%
Yaqui
0.0
/100
|
#314
Tragic
13.3%
Spanish Americans
0.0
/100
|
#315
Tragic
13.3%
Tsimshian
0.0
/100
|
#316
Tragic
13.3%