Immigrants from Zaire vs Immigrants from Sierra Leone Single Mother Households
COMPARE
Immigrants from Zaire
Immigrants from Sierra Leone
Single Mother Households
Single Mother Households Comparison
Immigrants from Zaire
Immigrants from Sierra Leone
7.4%
SINGLE MOTHER HOUSEHOLDS
0.2/ 100
METRIC RATING
260th/ 347
METRIC RANK
7.7%
SINGLE MOTHER HOUSEHOLDS
0.0/ 100
METRIC RATING
280th/ 347
METRIC RANK
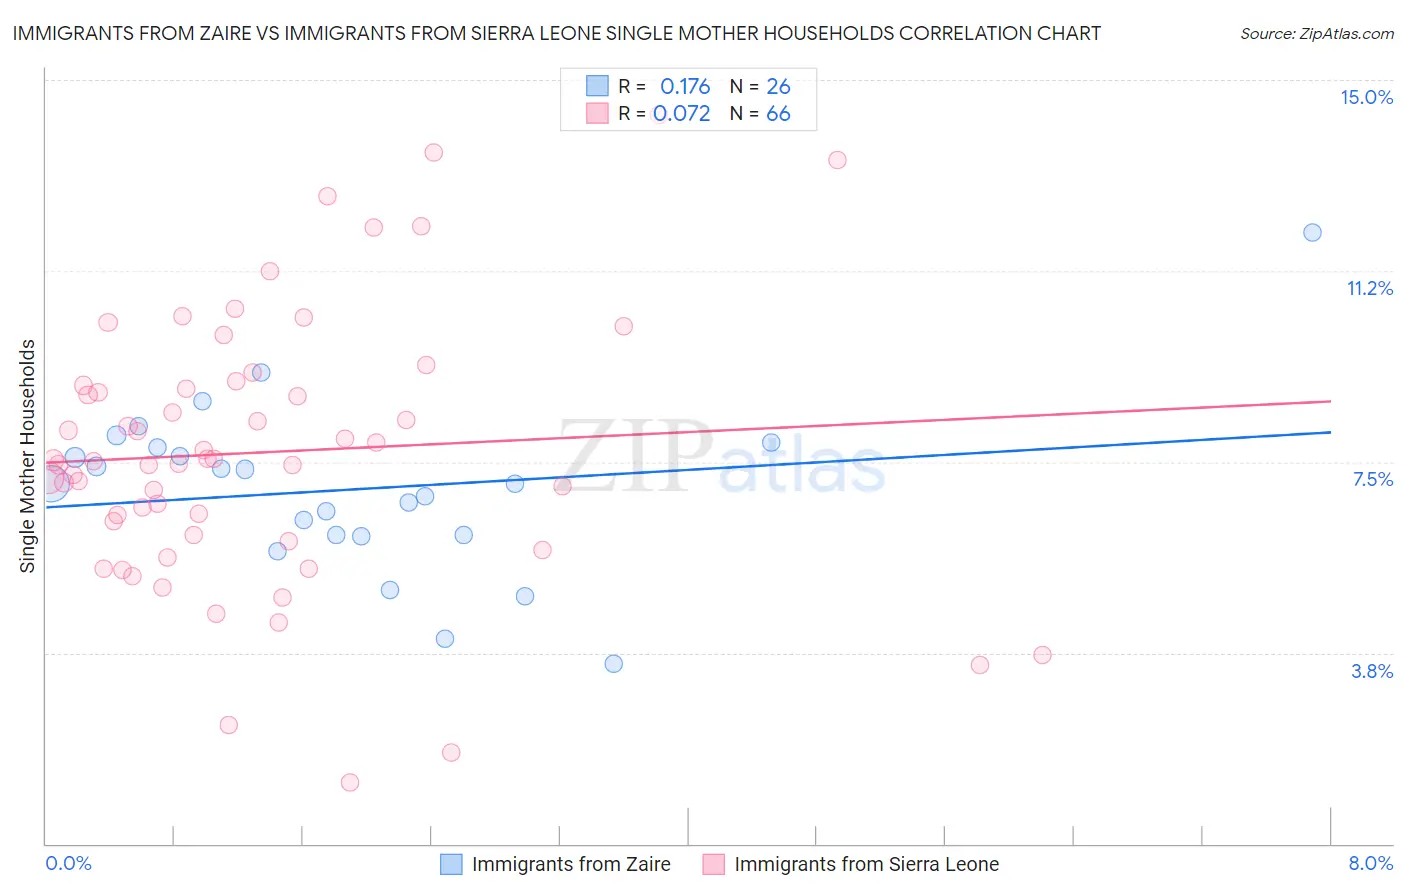
Immigrants from Zaire vs Immigrants from Sierra Leone Single Mother Households Correlation Chart
The statistical analysis conducted on geographies consisting of 107,226,907 people shows a poor positive correlation between the proportion of Immigrants from Zaire and percentage of single mother households in the United States with a correlation coefficient (R) of 0.176 and weighted average of 7.4%. Similarly, the statistical analysis conducted on geographies consisting of 101,563,361 people shows a slight positive correlation between the proportion of Immigrants from Sierra Leone and percentage of single mother households in the United States with a correlation coefficient (R) of 0.072 and weighted average of 7.7%, a difference of 3.5%.
Single Mother Households Correlation Summary
| Measurement | Immigrants from Zaire | Immigrants from Sierra Leone |
| Minimum | 3.5% | 1.2% |
| Maximum | 12.0% | 14.3% |
| Range | 8.5% | 13.1% |
| Mean | 7.0% | 7.7% |
| Median | 7.1% | 7.5% |
| Interquartile 25% (IQ1) | 6.1% | 6.1% |
| Interquartile 75% (IQ3) | 7.8% | 9.0% |
| Interquartile Range (IQR) | 1.7% | 3.0% |
| Standard Deviation (Sample) | 1.7% | 2.7% |
| Standard Deviation (Population) | 1.7% | 2.7% |
Demographics Similar to Immigrants from Zaire and Immigrants from Sierra Leone by Single Mother Households
In terms of single mother households, the demographic groups most similar to Immigrants from Zaire are Japanese (7.4%, a difference of 0.020%), Immigrants from Somalia (7.4%, a difference of 0.22%), Immigrants from Nicaragua (7.4%, a difference of 0.37%), Yaqui (7.4%, a difference of 0.45%), and Crow (7.4%, a difference of 0.63%). Similarly, the demographic groups most similar to Immigrants from Sierra Leone are Immigrants from El Salvador (7.6%, a difference of 0.52%), Central American (7.6%, a difference of 0.74%), Immigrants from Trinidad and Tobago (7.6%, a difference of 0.75%), Guyanese (7.6%, a difference of 0.79%), and Central American Indian (7.6%, a difference of 1.2%).
| Demographics | Rating | Rank | Single Mother Households |
| Immigrants | Zaire | 0.2 /100 | #260 | Tragic 7.4% |
| Japanese | 0.2 /100 | #261 | Tragic 7.4% |
| Immigrants | Somalia | 0.2 /100 | #262 | Tragic 7.4% |
| Immigrants | Nicaragua | 0.2 /100 | #263 | Tragic 7.4% |
| Yaqui | 0.1 /100 | #264 | Tragic 7.4% |
| Crow | 0.1 /100 | #265 | Tragic 7.4% |
| Nepalese | 0.1 /100 | #266 | Tragic 7.5% |
| Blackfeet | 0.1 /100 | #267 | Tragic 7.5% |
| Indonesians | 0.1 /100 | #268 | Tragic 7.5% |
| Somalis | 0.1 /100 | #269 | Tragic 7.5% |
| Immigrants | Cuba | 0.1 /100 | #270 | Tragic 7.5% |
| Salvadorans | 0.1 /100 | #271 | Tragic 7.5% |
| Immigrants | Azores | 0.1 /100 | #272 | Tragic 7.5% |
| Belizeans | 0.1 /100 | #273 | Tragic 7.6% |
| Immigrants | Guyana | 0.1 /100 | #274 | Tragic 7.6% |
| Central American Indians | 0.1 /100 | #275 | Tragic 7.6% |
| Guyanese | 0.1 /100 | #276 | Tragic 7.6% |
| Immigrants | Trinidad and Tobago | 0.1 /100 | #277 | Tragic 7.6% |
| Central Americans | 0.1 /100 | #278 | Tragic 7.6% |
| Immigrants | El Salvador | 0.0 /100 | #279 | Tragic 7.6% |
| Immigrants | Sierra Leone | 0.0 /100 | #280 | Tragic 7.7% |