Immigrants from Yemen vs Central American Single Mother Households
COMPARE
Immigrants from Yemen
Central American
Single Mother Households
Single Mother Households Comparison
Immigrants from Yemen
Central Americans
7.4%
SINGLE MOTHER HOUSEHOLDS
0.2/ 100
METRIC RATING
259th/ 347
METRIC RANK
7.6%
SINGLE MOTHER HOUSEHOLDS
0.1/ 100
METRIC RATING
278th/ 347
METRIC RANK
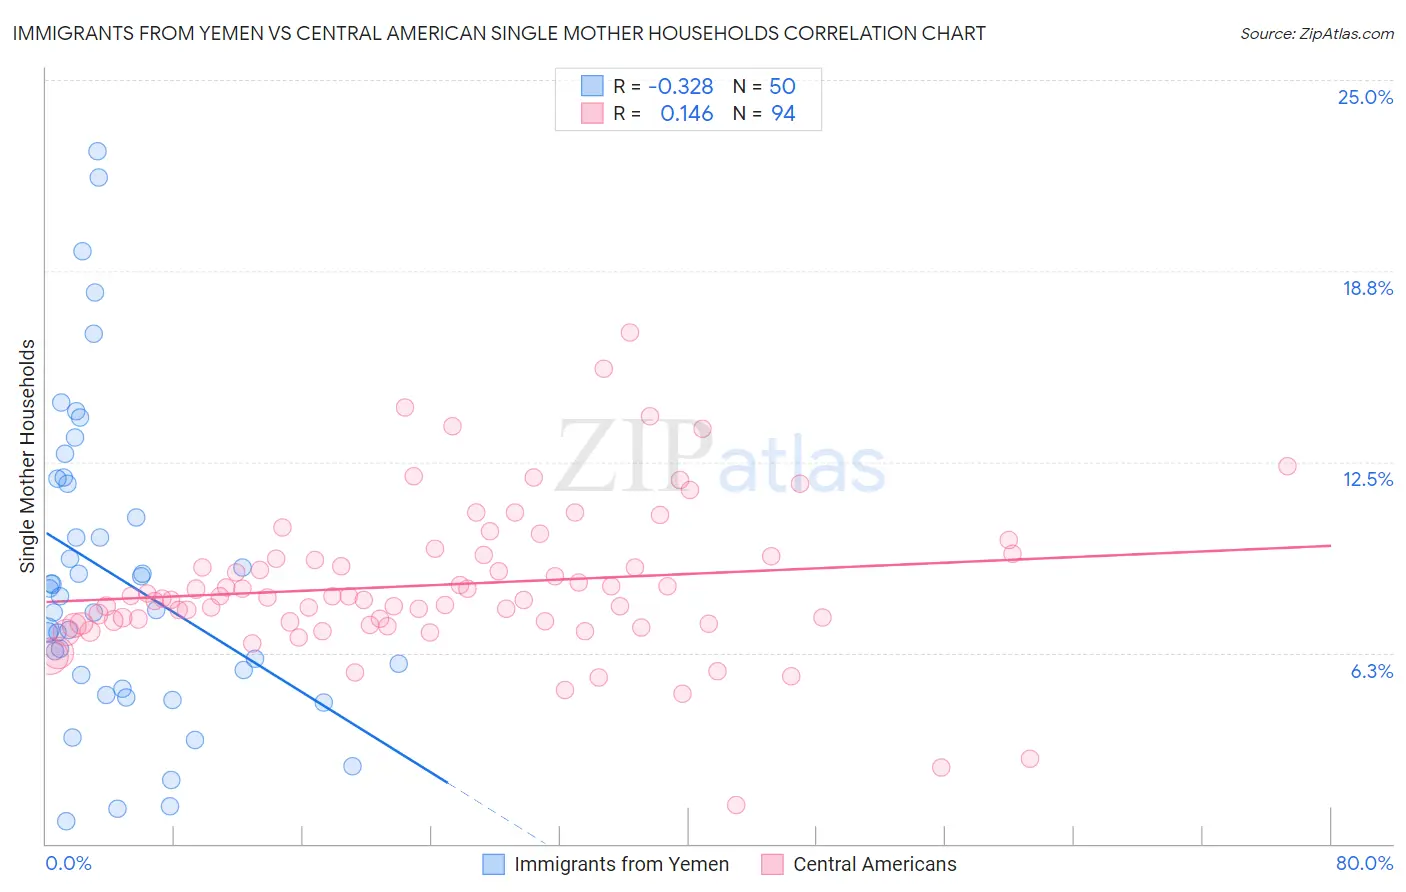
Immigrants from Yemen vs Central American Single Mother Households Correlation Chart
The statistical analysis conducted on geographies consisting of 82,424,194 people shows a mild negative correlation between the proportion of Immigrants from Yemen and percentage of single mother households in the United States with a correlation coefficient (R) of -0.328 and weighted average of 7.4%. Similarly, the statistical analysis conducted on geographies consisting of 502,537,291 people shows a poor positive correlation between the proportion of Central Americans and percentage of single mother households in the United States with a correlation coefficient (R) of 0.146 and weighted average of 7.6%, a difference of 2.8%.
Single Mother Households Correlation Summary
| Measurement | Immigrants from Yemen | Central American |
| Minimum | 0.75% | 1.3% |
| Maximum | 22.7% | 16.7% |
| Range | 21.9% | 15.5% |
| Mean | 8.7% | 8.5% |
| Median | 7.9% | 8.0% |
| Interquartile 25% (IQ1) | 5.5% | 7.2% |
| Interquartile 75% (IQ3) | 11.8% | 9.4% |
| Interquartile Range (IQR) | 6.3% | 2.2% |
| Standard Deviation (Sample) | 5.1% | 2.5% |
| Standard Deviation (Population) | 5.0% | 2.5% |
Demographics Similar to Immigrants from Yemen and Central Americans by Single Mother Households
In terms of single mother households, the demographic groups most similar to Immigrants from Yemen are Pueblo (7.4%, a difference of 0.020%), Immigrants from Zaire (7.4%, a difference of 0.040%), Japanese (7.4%, a difference of 0.060%), Immigrants from Somalia (7.4%, a difference of 0.26%), and Immigrants from Nicaragua (7.4%, a difference of 0.41%). Similarly, the demographic groups most similar to Central Americans are Immigrants from Trinidad and Tobago (7.6%, a difference of 0.0%), Guyanese (7.6%, a difference of 0.050%), Central American Indian (7.6%, a difference of 0.49%), Immigrants from Guyana (7.6%, a difference of 0.59%), and Belizean (7.6%, a difference of 0.64%).
| Demographics | Rating | Rank | Single Mother Households |
| Pueblo | 0.2 /100 | #258 | Tragic 7.4% |
| Immigrants | Yemen | 0.2 /100 | #259 | Tragic 7.4% |
| Immigrants | Zaire | 0.2 /100 | #260 | Tragic 7.4% |
| Japanese | 0.2 /100 | #261 | Tragic 7.4% |
| Immigrants | Somalia | 0.2 /100 | #262 | Tragic 7.4% |
| Immigrants | Nicaragua | 0.2 /100 | #263 | Tragic 7.4% |
| Yaqui | 0.1 /100 | #264 | Tragic 7.4% |
| Crow | 0.1 /100 | #265 | Tragic 7.4% |
| Nepalese | 0.1 /100 | #266 | Tragic 7.5% |
| Blackfeet | 0.1 /100 | #267 | Tragic 7.5% |
| Indonesians | 0.1 /100 | #268 | Tragic 7.5% |
| Somalis | 0.1 /100 | #269 | Tragic 7.5% |
| Immigrants | Cuba | 0.1 /100 | #270 | Tragic 7.5% |
| Salvadorans | 0.1 /100 | #271 | Tragic 7.5% |
| Immigrants | Azores | 0.1 /100 | #272 | Tragic 7.5% |
| Belizeans | 0.1 /100 | #273 | Tragic 7.6% |
| Immigrants | Guyana | 0.1 /100 | #274 | Tragic 7.6% |
| Central American Indians | 0.1 /100 | #275 | Tragic 7.6% |
| Guyanese | 0.1 /100 | #276 | Tragic 7.6% |
| Immigrants | Trinidad and Tobago | 0.1 /100 | #277 | Tragic 7.6% |
| Central Americans | 0.1 /100 | #278 | Tragic 7.6% |