Immigrants from Western Asia vs Puget Sound Salish Divorced or Separated
COMPARE
Immigrants from Western Asia
Puget Sound Salish
Divorced or Separated
Divorced or Separated Comparison
Immigrants from Western Asia
Puget Sound Salish
11.2%
DIVORCED OR SEPARATED
100.0/ 100
METRIC RATING
44th/ 347
METRIC RANK
13.4%
DIVORCED OR SEPARATED
0.0/ 100
METRIC RATING
319th/ 347
METRIC RANK
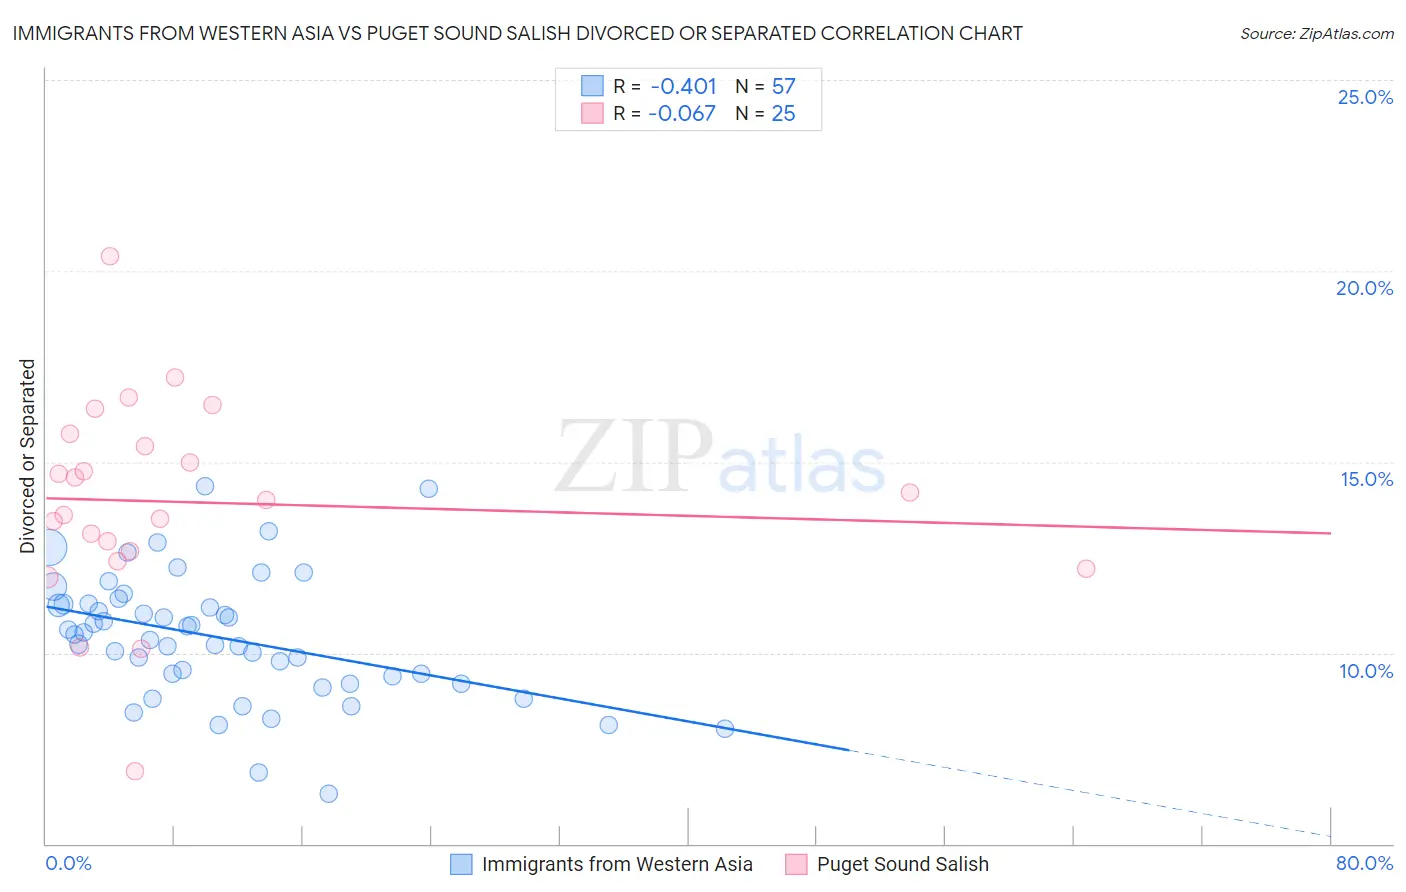
Immigrants from Western Asia vs Puget Sound Salish Divorced or Separated Correlation Chart
The statistical analysis conducted on geographies consisting of 404,250,440 people shows a moderate negative correlation between the proportion of Immigrants from Western Asia and percentage of population currently divorced or separated in the United States with a correlation coefficient (R) of -0.401 and weighted average of 11.2%. Similarly, the statistical analysis conducted on geographies consisting of 46,155,746 people shows a slight negative correlation between the proportion of Puget Sound Salish and percentage of population currently divorced or separated in the United States with a correlation coefficient (R) of -0.067 and weighted average of 13.4%, a difference of 19.4%.
Divorced or Separated Correlation Summary
| Measurement | Immigrants from Western Asia | Puget Sound Salish |
| Minimum | 6.3% | 6.9% |
| Maximum | 14.4% | 20.4% |
| Range | 8.1% | 13.5% |
| Mean | 10.4% | 13.9% |
| Median | 10.5% | 14.0% |
| Interquartile 25% (IQ1) | 9.3% | 12.5% |
| Interquartile 75% (IQ3) | 11.3% | 15.6% |
| Interquartile Range (IQR) | 2.0% | 3.0% |
| Standard Deviation (Sample) | 1.6% | 2.7% |
| Standard Deviation (Population) | 1.6% | 2.6% |
Similar Demographics by Divorced or Separated
Demographics Similar to Immigrants from Western Asia by Divorced or Separated
In terms of divorced or separated, the demographic groups most similar to Immigrants from Western Asia are Immigrants from Belarus (11.2%, a difference of 0.010%), Chinese (11.2%, a difference of 0.020%), Turkish (11.2%, a difference of 0.050%), Bhutanese (11.2%, a difference of 0.090%), and Laotian (11.2%, a difference of 0.16%).
| Demographics | Rating | Rank | Divorced or Separated |
| Immigrants | Lebanon | 100.0 /100 | #37 | Exceptional 11.1% |
| Immigrants | Greece | 100.0 /100 | #38 | Exceptional 11.1% |
| Immigrants | Egypt | 100.0 /100 | #39 | Exceptional 11.1% |
| Soviet Union | 100.0 /100 | #40 | Exceptional 11.1% |
| Bhutanese | 100.0 /100 | #41 | Exceptional 11.2% |
| Chinese | 100.0 /100 | #42 | Exceptional 11.2% |
| Immigrants | Belarus | 100.0 /100 | #43 | Exceptional 11.2% |
| Immigrants | Western Asia | 100.0 /100 | #44 | Exceptional 11.2% |
| Turks | 100.0 /100 | #45 | Exceptional 11.2% |
| Laotians | 100.0 /100 | #46 | Exceptional 11.2% |
| Immigrants | Poland | 100.0 /100 | #47 | Exceptional 11.2% |
| Immigrants | Turkey | 100.0 /100 | #48 | Exceptional 11.2% |
| Immigrants | Saudi Arabia | 100.0 /100 | #49 | Exceptional 11.2% |
| Bolivians | 100.0 /100 | #50 | Exceptional 11.2% |
| Immigrants | Bolivia | 100.0 /100 | #51 | Exceptional 11.3% |
Demographics Similar to Puget Sound Salish by Divorced or Separated
In terms of divorced or separated, the demographic groups most similar to Puget Sound Salish are Cree (13.4%, a difference of 0.040%), Haitian (13.3%, a difference of 0.060%), Cajun (13.4%, a difference of 0.060%), Tsimshian (13.3%, a difference of 0.080%), and Spanish American (13.3%, a difference of 0.12%).
| Demographics | Rating | Rank | Divorced or Separated |
| Blackfeet | 0.0 /100 | #312 | Tragic 13.3% |
| Immigrants | Nicaragua | 0.0 /100 | #313 | Tragic 13.3% |
| Yaqui | 0.0 /100 | #314 | Tragic 13.3% |
| Spanish Americans | 0.0 /100 | #315 | Tragic 13.3% |
| Tsimshian | 0.0 /100 | #316 | Tragic 13.3% |
| Haitians | 0.0 /100 | #317 | Tragic 13.3% |
| Cree | 0.0 /100 | #318 | Tragic 13.4% |
| Puget Sound Salish | 0.0 /100 | #319 | Tragic 13.4% |
| Cajuns | 0.0 /100 | #320 | Tragic 13.4% |
| Cheyenne | 0.0 /100 | #321 | Tragic 13.4% |
| Immigrants | Haiti | 0.0 /100 | #322 | Tragic 13.4% |
| U.S. Virgin Islanders | 0.0 /100 | #323 | Tragic 13.4% |
| Osage | 0.0 /100 | #324 | Tragic 13.4% |
| Potawatomi | 0.0 /100 | #325 | Tragic 13.5% |
| Immigrants | Congo | 0.0 /100 | #326 | Tragic 13.5% |