Immigrants from Venezuela vs Yaqui Single Mother Households

COMPARE

Immigrants from Venezuela
Race
Ancestry
AfghanAfricanAlaska NativeAlaskan AthabascanAlbanianAleutAlsatianAmericanApacheArabArapahoArgentineanArmenianAssyrian/Chaldean/SyriacAustralianAustrianBahamianBangladeshiBarbadianBasqueBelgianBelizeanBermudanBhutaneseBlackfeetBolivianBrazilianBritishBritish West IndianBulgarianBurmeseCajunCambodianCanadianCape VerdeanCarpatho RusynCelticCentral AmericanCentral American IndianCherokeeCheyenneChickasawChileanChineseChippewaChoctawColombianColvilleComancheCosta RicanCreeCreekCroatianCrowCubanCypriotCzechCzechoslovakianDanishDelawareDominicanDutchDutch West IndianEastern EuropeanEcuadorianEgyptianEnglishEstonianEthiopianEuropeanFijianFilipinoFinnishFrenchFrench American IndianFrench CanadianGermanGerman RussianGhanaianGreekGuamanian/ChamorroGuatemalanGuyaneseHaitianHmongHonduranHopiHoumaHungarianIcelanderIndian (Asian)IndonesianInupiatIranianIraqiIrishIroquoisIsraeliItalianJamaicanJapaneseJordanianKenyanKiowaKoreanLaotianLatvianLebaneseLiberianLithuanianLumbeeLuxembourgerMacedonianMalaysianMalteseMarshalleseMenomineeMexicanMexican American IndianMongolianMoroccanNative HawaiianNavajoNepaleseNew ZealanderNicaraguanNigerianNorthern EuropeanNorwegianOkinawanOsageOttawaPaiutePakistaniPalestinianPanamanianParaguayanPennsylvania GermanPeruvianPimaPolishPortuguesePotawatomiPuebloPuerto RicanPuget Sound SalishRomanianRussianSalvadoranSamoanScandinavianScotch-IrishScottishSeminoleSenegaleseSerbianShoshoneSierra LeoneanSiouxSlavicSlovakSloveneSomaliSouth AfricanSouth AmericanSouth American IndianSoviet UnionSpaniardSpanishSpanish AmericanSpanish American IndianSri LankanSubsaharan AfricanSudaneseSwedishSwissSyrianTaiwaneseThaiTlingit-HaidaTohono O'OdhamTonganTrinidadian and TobagonianTsimshianTurkishU.S. Virgin IslanderUgandanUkrainianUruguayanUteVenezuelanVietnameseWelshWest IndianYakamaYugoslavianYumanYup'ikZimbabwean
Immigration
NonimmigrantsImmigrantsAfghanistanAfricaAlbaniaArgentinaArmeniaAsiaAustraliaAustriaBahamasBangladeshBarbadosBelarusBelgiumBelizeBoliviaBosnia and HerzegovinaBrazilBulgariaBurma/MyanmarCabo VerdeCambodiaCameroonCanadaCaribbeanCentral AmericaChileChinaColombiaCongoCosta RicaCroatiaCubaCzechoslovakiaDenmarkDominicaDominican RepublicEastern AfricaEastern AsiaEastern EuropeEcuadorEgyptEl SalvadorEnglandEritreaEthiopiaEuropeFijiFranceGermanyGhanaGreeceGrenadaGuatemalaGuyanaHaitiHondurasHong KongHungaryIndiaIndonesiaIranIraqIrelandIsraelItalyJamaicaJapanJordanKazakhstanKenyaKoreaKuwaitLaosLatin AmericaLatviaLebanonLiberiaLithuaniaMalaysiaMexicoMicronesiaMiddle AfricaMoldovaMoroccoNepalNetherlandsNicaraguaNigeriaNorth AmericaNorth MacedoniaNorthern AfricaNorthern EuropeNorwayOceaniaPakistanPanamaPeruPhilippinesPolandPortugalRomaniaRussiaSaudi ArabiaScotlandSenegalSerbiaSierra LeoneSingaporeSomaliaSouth AfricaSouth AmericaSouth Central AsiaSouth Eastern AsiaSouthern EuropeSpainSri LankaSt. Vincent and the GrenadinesSudanSwedenSwitzerlandSyriaTaiwanThailandTrinidad and TobagoTurkeyUgandaUkraineUruguayUzbekistanVenezuelaVietnamWest IndiesWestern AfricaWestern AsiaWestern EuropeYemenZaireZimbabweAzores
Yaqui
Race
Ancestry
AfghanAfricanAlaska NativeAlaskan AthabascanAlbanianAleutAlsatianAmericanApacheArabArapahoArgentineanArmenianAssyrian/Chaldean/SyriacAustralianAustrianBahamianBangladeshiBarbadianBasqueBelgianBelizeanBermudanBhutaneseBlackfeetBolivianBrazilianBritishBritish West IndianBulgarianBurmeseCajunCambodianCanadianCape VerdeanCarpatho RusynCelticCentral AmericanCentral American IndianCherokeeCheyenneChickasawChileanChineseChippewaChoctawColombianColvilleComancheCosta RicanCreeCreekCroatianCrowCubanCypriotCzechCzechoslovakianDanishDelawareDominicanDutchDutch West IndianEastern EuropeanEcuadorianEgyptianEnglishEstonianEthiopianEuropeanFijianFilipinoFinnishFrenchFrench American IndianFrench CanadianGermanGerman RussianGhanaianGreekGuamanian/ChamorroGuatemalanGuyaneseHaitianHmongHonduranHopiHoumaHungarianIcelanderIndian (Asian)IndonesianInupiatIranianIraqiIrishIroquoisIsraeliItalianJamaicanJapaneseJordanianKenyanKiowaKoreanLaotianLatvianLebaneseLiberianLithuanianLumbeeLuxembourgerMacedonianMalaysianMalteseMarshalleseMenomineeMexicanMexican American IndianMongolianMoroccanNative HawaiianNavajoNepaleseNew ZealanderNicaraguanNigerianNorthern EuropeanNorwegianOkinawanOsageOttawaPaiutePakistaniPalestinianPanamanianParaguayanPennsylvania GermanPeruvianPimaPolishPortuguesePotawatomiPuebloPuerto RicanPuget Sound SalishRomanianRussianSalvadoranSamoanScandinavianScotch-IrishScottishSeminoleSenegaleseSerbianShoshoneSierra LeoneanSiouxSlavicSlovakSloveneSomaliSouth AfricanSouth AmericanSouth American IndianSoviet UnionSpaniardSpanishSpanish AmericanSpanish American IndianSri LankanSubsaharan AfricanSudaneseSwedishSwissSyrianTaiwaneseThaiTlingit-HaidaTohono O'OdhamTonganTrinidadian and TobagonianTsimshianTurkishU.S. Virgin IslanderUgandanUkrainianUruguayanUteVenezuelanVietnameseWelshWest IndianYakamaYaquiYugoslavianYumanYup'ikZimbabwean
Immigration
NonimmigrantsImmigrantsAfghanistanAfricaAlbaniaArgentinaArmeniaAsiaAustraliaAustriaBahamasBangladeshBarbadosBelarusBelgiumBelizeBoliviaBosnia and HerzegovinaBrazilBulgariaBurma/MyanmarCabo VerdeCambodiaCameroonCanadaCaribbeanCentral AmericaChileChinaColombiaCongoCosta RicaCroatiaCubaCzechoslovakiaDenmarkDominicaDominican RepublicEastern AfricaEastern AsiaEastern EuropeEcuadorEgyptEl SalvadorEnglandEritreaEthiopiaEuropeFijiFranceGermanyGhanaGreeceGrenadaGuatemalaGuyanaHaitiHondurasHong KongHungaryIndiaIndonesiaIranIraqIrelandIsraelItalyJamaicaJapanJordanKazakhstanKenyaKoreaKuwaitLaosLatin AmericaLatviaLebanonLiberiaLithuaniaMalaysiaMexicoMicronesiaMiddle AfricaMoldovaMoroccoNepalNetherlandsNicaraguaNigeriaNorth AmericaNorth MacedoniaNorthern AfricaNorthern EuropeNorwayOceaniaPakistanPanamaPeruPhilippinesPolandPortugalRomaniaRussiaSaudi ArabiaScotlandSenegalSerbiaSierra LeoneSingaporeSomaliaSouth AfricaSouth AmericaSouth Central AsiaSouth Eastern AsiaSouthern EuropeSpainSri LankaSt. Vincent and the GrenadinesSudanSwedenSwitzerlandSyriaTaiwanThailandTrinidad and TobagoTurkeyUgandaUkraineUruguayUzbekistanVietnamWest IndiesWestern AfricaWestern AsiaWestern EuropeYemenZaireZimbabweAzores
Single Mother Households
Income
Poverty
Unemployment
Labor Participation
Family Structure
Vehicle Availability
Education Level
Disability

Single Mother Households Comparison

Immigrants from Venezuela

Yaqui

Tragic
Tragic
6.7%
SINGLE MOTHER HOUSEHOLDS
8.5/ 100
METRIC RATING
211th/ 347
METRIC RANK
7.4%
SINGLE MOTHER HOUSEHOLDS
0.1/ 100
METRIC RATING
264th/ 347
METRIC RANK

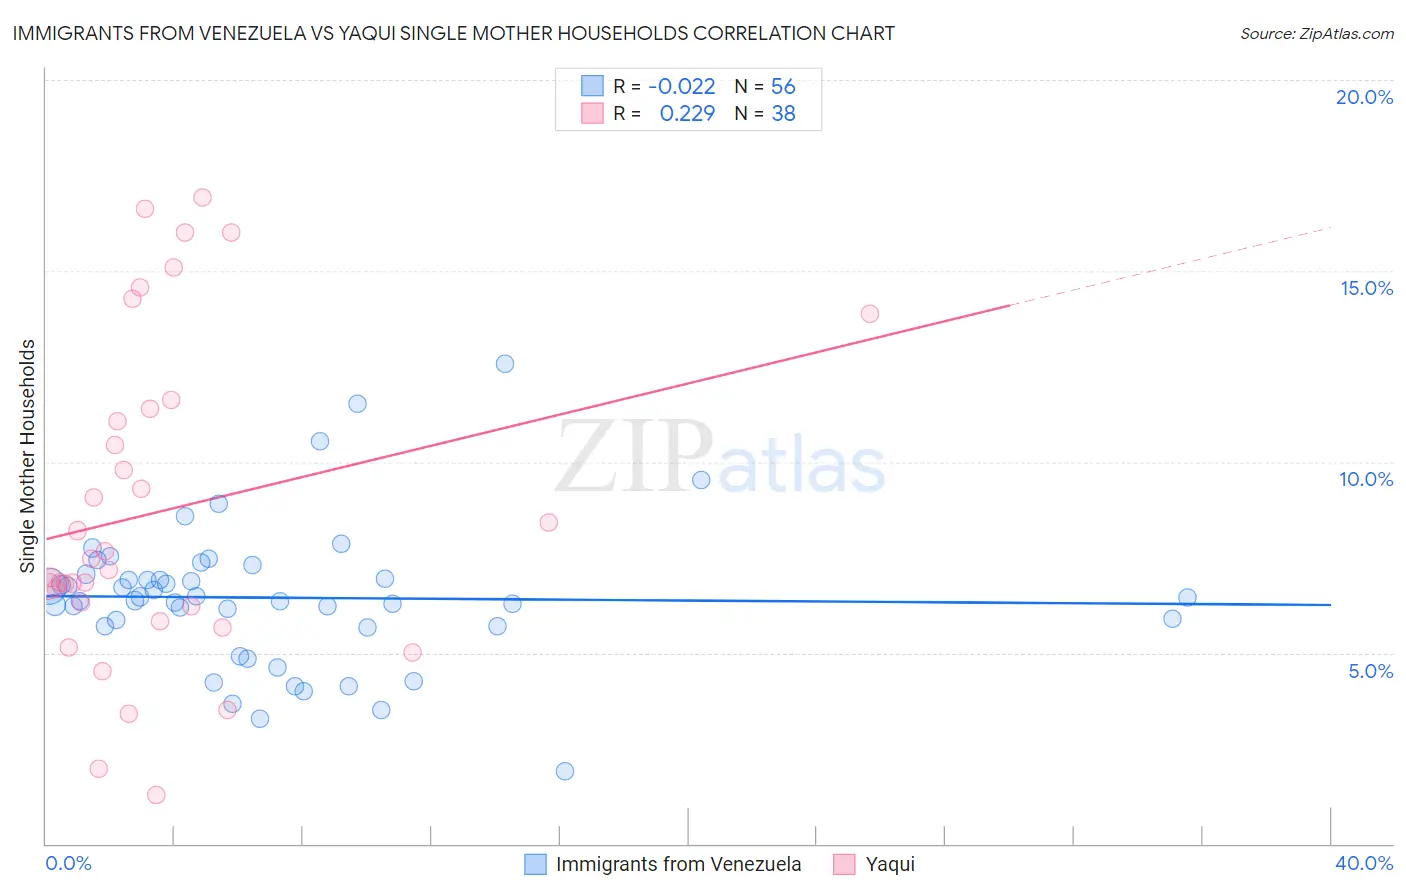
Immigrants from Venezuela vs Yaqui Single Mother Households Correlation Chart

The statistical analysis conducted on geographies consisting of 287,554,408 people shows no correlation between the proportion of Immigrants from Venezuela and percentage of single mother households in the United States with a correlation coefficient (R) of -0.022 and weighted average of 6.7%. Similarly, the statistical analysis conducted on geographies consisting of 107,663,122 people shows a weak positive correlation between the proportion of Yaqui and percentage of single mother households in the United States with a correlation coefficient (R) of 0.229 and weighted average of 7.4%, a difference of 10.6%.
Immigrants from Venezuela vs Yaqui Single Mother Households

Single Mother Households Correlation Summary

MeasurementImmigrants from VenezuelaYaqui
Minimum1.9%1.3%
Maximum12.6%16.9%
Range10.6%15.6%
Mean6.4%8.7%
Median6.4%7.3%
Interquartile 25% (IQ1)5.7%6.2%
Interquartile 75% (IQ3)7.0%11.4%
Interquartile Range (IQR)1.3%5.2%
Standard Deviation (Sample)1.9%4.2%
Standard Deviation (Population)1.9%4.2%

Similar Demographics by Single Mother Households

Demographics Similar to Immigrants from Venezuela by Single Mother Households

In terms of single mother households, the demographic groups most similar to Immigrants from Venezuela are Immigrants from Eritrea (6.7%, a difference of 0.050%), Immigrants from Costa Rica (6.7%, a difference of 0.11%), Immigrants from Uruguay (6.7%, a difference of 0.22%), Nonimmigrants (6.7%, a difference of 0.58%), and Immigrants from Colombia (6.7%, a difference of 0.60%).
DemographicsRating | RankSingle Mother Households
Immigrants | Fiji
11.9
/100
|
#204
Poor
6.7%
Cree
11.9
/100
|
#205
Poor
6.7%
German Russians
11.5
/100
|
#206
Poor
6.7%
Immigrants | South America
11.5
/100
|
#207
Poor
6.7%
Vietnamese
11.3
/100
|
#208
Poor
6.7%
Immigrants | Colombia
10.5
/100
|
#209
Poor
6.7%
Immigrants | Nonimmigrants
10.4
/100
|
#210
Poor
6.7%
Immigrants | Venezuela
8.5
/100
|
#211
Tragic
6.7%
Immigrants | Eritrea
8.4
/100
|
#212
Tragic
6.7%
Immigrants | Costa Rica
8.2
/100
|
#213
Tragic
6.7%
Immigrants | Uruguay
7.9
/100
|
#214
Tragic
6.7%
Shoshone
5.7
/100
|
#215
Tragic
6.8%
Cherokee
5.1
/100
|
#216
Tragic
6.8%
Aleuts
4.8
/100
|
#217
Tragic
6.8%
Immigrants | Eastern Africa
4.4
/100
|
#218
Tragic
6.8%

Demographics Similar to Yaqui by Single Mother Households

In terms of single mother households, the demographic groups most similar to Yaqui are Immigrants from Nicaragua (7.4%, a difference of 0.080%), Crow (7.4%, a difference of 0.18%), Immigrants from Somalia (7.4%, a difference of 0.23%), Nepalese (7.5%, a difference of 0.27%), and Japanese (7.4%, a difference of 0.43%).
DemographicsRating | RankSingle Mother Households
Alaska Natives
0.2
/100
|
#257
Tragic
7.4%
Pueblo
0.2
/100
|
#258
Tragic
7.4%
Immigrants | Yemen
0.2
/100
|
#259
Tragic
7.4%
Immigrants | Zaire
0.2
/100
|
#260
Tragic
7.4%
Japanese
0.2
/100
|
#261
Tragic
7.4%
Immigrants | Somalia
0.2
/100
|
#262
Tragic
7.4%
Immigrants | Nicaragua
0.2
/100
|
#263
Tragic
7.4%
Yaqui
0.1
/100
|
#264
Tragic
7.4%
Crow
0.1
/100
|
#265
Tragic
7.4%
Nepalese
0.1
/100
|
#266
Tragic
7.5%
Blackfeet
0.1
/100
|
#267
Tragic
7.5%
Indonesians
0.1
/100
|
#268
Tragic
7.5%
Somalis
0.1
/100
|
#269
Tragic
7.5%
Immigrants | Cuba
0.1
/100
|
#270
Tragic
7.5%
Salvadorans
0.1
/100
|
#271
Tragic
7.5%