Immigrants from Venezuela vs Immigrants from the Azores Single Father Households

COMPARE

Immigrants from Venezuela
Race
Ancestry
AfghanAfricanAlaska NativeAlaskan AthabascanAlbanianAleutAlsatianAmericanApacheArabArapahoArgentineanArmenianAssyrian/Chaldean/SyriacAustralianAustrianBahamianBangladeshiBarbadianBasqueBelgianBelizeanBermudanBhutaneseBlackfeetBolivianBrazilianBritishBritish West IndianBulgarianBurmeseCajunCambodianCanadianCape VerdeanCarpatho RusynCelticCentral AmericanCentral American IndianCherokeeCheyenneChickasawChileanChineseChippewaChoctawColombianColvilleComancheCosta RicanCreeCreekCroatianCrowCubanCypriotCzechCzechoslovakianDanishDelawareDominicanDutchDutch West IndianEastern EuropeanEcuadorianEgyptianEnglishEstonianEthiopianEuropeanFijianFilipinoFinnishFrenchFrench American IndianFrench CanadianGermanGerman RussianGhanaianGreekGuamanian/ChamorroGuatemalanGuyaneseHaitianHmongHonduranHopiHoumaHungarianIcelanderIndian (Asian)IndonesianInupiatIranianIraqiIrishIroquoisIsraeliItalianJamaicanJapaneseJordanianKenyanKiowaKoreanLaotianLatvianLebaneseLiberianLithuanianLumbeeLuxembourgerMacedonianMalaysianMalteseMarshalleseMenomineeMexicanMexican American IndianMongolianMoroccanNative HawaiianNavajoNepaleseNew ZealanderNicaraguanNigerianNorthern EuropeanNorwegianOkinawanOsageOttawaPaiutePakistaniPalestinianPanamanianParaguayanPennsylvania GermanPeruvianPimaPolishPortuguesePotawatomiPuebloPuerto RicanPuget Sound SalishRomanianRussianSalvadoranSamoanScandinavianScotch-IrishScottishSeminoleSenegaleseSerbianShoshoneSierra LeoneanSiouxSlavicSlovakSloveneSomaliSouth AfricanSouth AmericanSouth American IndianSoviet UnionSpaniardSpanishSpanish AmericanSpanish American IndianSri LankanSubsaharan AfricanSudaneseSwedishSwissSyrianTaiwaneseThaiTlingit-HaidaTohono O'OdhamTonganTrinidadian and TobagonianTsimshianTurkishU.S. Virgin IslanderUgandanUkrainianUruguayanUteVenezuelanVietnameseWelshWest IndianYakamaYaquiYugoslavianYumanYup'ikZimbabwean
Immigration
NonimmigrantsImmigrantsAfghanistanAfricaAlbaniaArgentinaArmeniaAsiaAustraliaAustriaBahamasBangladeshBarbadosBelarusBelgiumBelizeBoliviaBosnia and HerzegovinaBrazilBulgariaBurma/MyanmarCabo VerdeCambodiaCameroonCanadaCaribbeanCentral AmericaChileChinaColombiaCongoCosta RicaCroatiaCubaCzechoslovakiaDenmarkDominicaDominican RepublicEastern AfricaEastern AsiaEastern EuropeEcuadorEgyptEl SalvadorEnglandEritreaEthiopiaEuropeFijiFranceGermanyGhanaGreeceGrenadaGuatemalaGuyanaHaitiHondurasHong KongHungaryIndiaIndonesiaIranIraqIrelandIsraelItalyJamaicaJapanJordanKazakhstanKenyaKoreaKuwaitLaosLatin AmericaLatviaLebanonLiberiaLithuaniaMalaysiaMexicoMicronesiaMiddle AfricaMoldovaMoroccoNepalNetherlandsNicaraguaNigeriaNorth AmericaNorth MacedoniaNorthern AfricaNorthern EuropeNorwayOceaniaPakistanPanamaPeruPhilippinesPolandPortugalRomaniaRussiaSaudi ArabiaScotlandSenegalSerbiaSierra LeoneSingaporeSomaliaSouth AfricaSouth AmericaSouth Central AsiaSouth Eastern AsiaSouthern EuropeSpainSri LankaSt. Vincent and the GrenadinesSudanSwedenSwitzerlandSyriaTaiwanThailandTrinidad and TobagoTurkeyUgandaUkraineUruguayUzbekistanVenezuelaVietnamWest IndiesWestern AfricaWestern AsiaWestern EuropeYemenZaireZimbabwe
Immigrants from the Azores
Race
Ancestry
AfghanAfricanAlaska NativeAlaskan AthabascanAlbanianAleutAlsatianAmericanApacheArabArapahoArgentineanArmenianAssyrian/Chaldean/SyriacAustralianAustrianBahamianBangladeshiBarbadianBasqueBelgianBelizeanBermudanBhutaneseBlackfeetBolivianBrazilianBritishBritish West IndianBulgarianBurmeseCajunCambodianCanadianCape VerdeanCarpatho RusynCelticCentral AmericanCentral American IndianCherokeeCheyenneChickasawChileanChineseChippewaChoctawColombianColvilleComancheCosta RicanCreeCreekCroatianCrowCubanCypriotCzechCzechoslovakianDanishDelawareDominicanDutchDutch West IndianEastern EuropeanEcuadorianEgyptianEnglishEstonianEthiopianEuropeanFijianFilipinoFinnishFrenchFrench American IndianFrench CanadianGermanGerman RussianGhanaianGreekGuamanian/ChamorroGuatemalanGuyaneseHaitianHmongHonduranHopiHoumaHungarianIcelanderIndian (Asian)IndonesianInupiatIranianIraqiIrishIroquoisIsraeliItalianJamaicanJapaneseJordanianKenyanKiowaKoreanLaotianLatvianLebaneseLiberianLithuanianLumbeeLuxembourgerMacedonianMalaysianMalteseMarshalleseMenomineeMexicanMexican American IndianMongolianMoroccanNative HawaiianNavajoNepaleseNew ZealanderNicaraguanNigerianNorthern EuropeanNorwegianOkinawanOsageOttawaPaiutePakistaniPalestinianPanamanianParaguayanPennsylvania GermanPeruvianPimaPolishPortuguesePotawatomiPuebloPuerto RicanPuget Sound SalishRomanianRussianSalvadoranSamoanScandinavianScotch-IrishScottishSeminoleSenegaleseSerbianShoshoneSierra LeoneanSiouxSlavicSlovakSloveneSomaliSouth AfricanSouth AmericanSouth American IndianSoviet UnionSpaniardSpanishSpanish AmericanSpanish American IndianSri LankanSubsaharan AfricanSudaneseSwedishSwissSyrianTaiwaneseThaiTlingit-HaidaTohono O'OdhamTonganTrinidadian and TobagonianTsimshianTurkishU.S. Virgin IslanderUgandanUkrainianUruguayanUteVenezuelanVietnameseWelshWest IndianYakamaYaquiYugoslavianYumanYup'ikZimbabwean
Immigration
NonimmigrantsImmigrantsAfghanistanAfricaAlbaniaArgentinaArmeniaAsiaAustraliaAustriaBahamasBangladeshBarbadosBelarusBelgiumBelizeBoliviaBosnia and HerzegovinaBrazilBulgariaBurma/MyanmarCabo VerdeCambodiaCameroonCanadaCaribbeanCentral AmericaChileChinaColombiaCongoCosta RicaCroatiaCubaCzechoslovakiaDenmarkDominicaDominican RepublicEastern AfricaEastern AsiaEastern EuropeEcuadorEgyptEl SalvadorEnglandEritreaEthiopiaEuropeFijiFranceGermanyGhanaGreeceGrenadaGuatemalaGuyanaHaitiHondurasHong KongHungaryIndiaIndonesiaIranIraqIrelandIsraelItalyJamaicaJapanJordanKazakhstanKenyaKoreaKuwaitLaosLatin AmericaLatviaLebanonLiberiaLithuaniaMalaysiaMexicoMicronesiaMiddle AfricaMoldovaMoroccoNepalNetherlandsNicaraguaNigeriaNorth AmericaNorth MacedoniaNorthern AfricaNorthern EuropeNorwayOceaniaPakistanPanamaPeruPhilippinesPolandPortugalRomaniaRussiaSaudi ArabiaScotlandSenegalSerbiaSierra LeoneSingaporeSomaliaSouth AfricaSouth AmericaSouth Central AsiaSouth Eastern AsiaSouthern EuropeSpainSri LankaSt. Vincent and the GrenadinesSudanSwedenSwitzerlandSyriaTaiwanThailandTrinidad and TobagoTurkeyUgandaUkraineUruguayUzbekistanVietnamWest IndiesWestern AfricaWestern AsiaWestern EuropeYemenZaireZimbabweAzores
Single Father Households
Income
Poverty
Unemployment
Labor Participation
Family Structure
Vehicle Availability
Education Level
Disability

Single Father Households Comparison

Immigrants from Venezuela

Immigrants from the Azores

Excellent
Tragic
2.3%
SINGLE FATHER HOUSEHOLDS
83.2/ 100
METRIC RATING
152nd/ 347
METRIC RANK
2.8%
SINGLE FATHER HOUSEHOLDS
0.0/ 100
METRIC RATING
306th/ 347
METRIC RANK

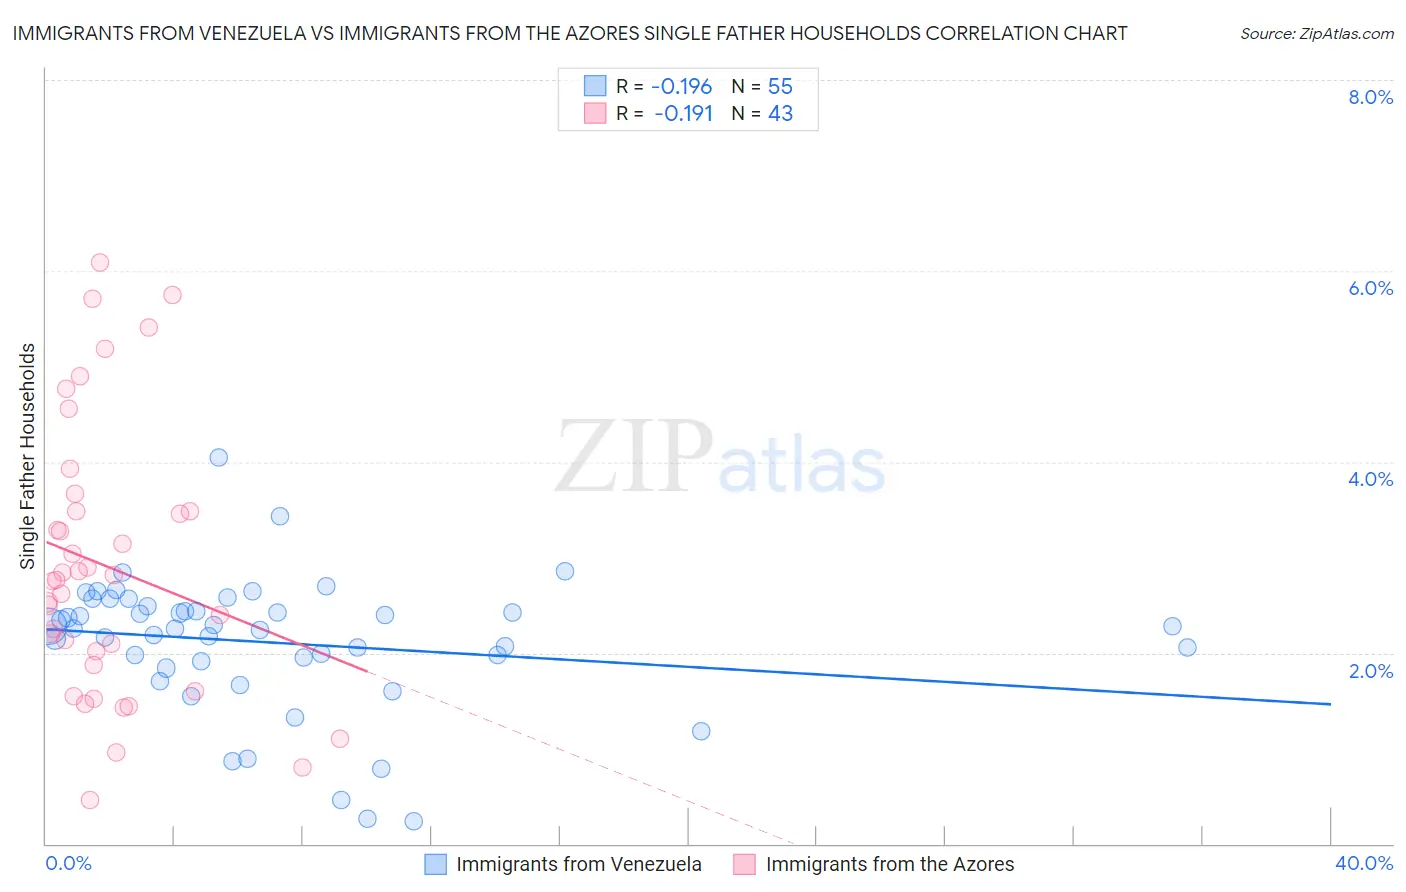
Immigrants from Venezuela vs Immigrants from the Azores Single Father Households Correlation Chart

The statistical analysis conducted on geographies consisting of 286,595,714 people shows a poor negative correlation between the proportion of Immigrants from Venezuela and percentage of single father households in the United States with a correlation coefficient (R) of -0.196 and weighted average of 2.3%. Similarly, the statistical analysis conducted on geographies consisting of 46,035,225 people shows a poor negative correlation between the proportion of Immigrants from the Azores and percentage of single father households in the United States with a correlation coefficient (R) of -0.191 and weighted average of 2.8%, a difference of 24.4%.
Immigrants from Venezuela vs Immigrants from the Azores Single Father Households

Single Father Households Correlation Summary

MeasurementImmigrants from VenezuelaImmigrants from the Azores
Minimum0.23%0.46%
Maximum4.1%6.1%
Range3.8%5.6%
Mean2.1%2.9%
Median2.3%2.8%
Interquartile 25% (IQ1)1.9%1.9%
Interquartile 75% (IQ3)2.5%3.5%
Interquartile Range (IQR)0.58%1.6%
Standard Deviation (Sample)0.71%1.4%
Standard Deviation (Population)0.70%1.4%

Similar Demographics by Single Father Households

Demographics Similar to Immigrants from Venezuela by Single Father Households

In terms of single father households, the demographic groups most similar to Immigrants from Venezuela are Immigrants from Germany (2.3%, a difference of 0.050%), Immigrants from Syria (2.3%, a difference of 0.23%), Bolivian (2.3%, a difference of 0.28%), European (2.3%, a difference of 0.29%), and Immigrants from South America (2.3%, a difference of 0.41%).
DemographicsRating | RankSingle Father Households
Immigrants | Zimbabwe
90.2
/100
|
#145
Exceptional
2.2%
Northern Europeans
89.8
/100
|
#146
Excellent
2.2%
Slavs
88.9
/100
|
#147
Excellent
2.2%
South American Indians
88.5
/100
|
#148
Excellent
2.3%
Senegalese
88.4
/100
|
#149
Excellent
2.3%
Venezuelans
86.2
/100
|
#150
Excellent
2.3%
Immigrants | Syria
84.8
/100
|
#151
Excellent
2.3%
Immigrants | Venezuela
83.2
/100
|
#152
Excellent
2.3%
Immigrants | Germany
82.8
/100
|
#153
Excellent
2.3%
Bolivians
81.0
/100
|
#154
Excellent
2.3%
Europeans
80.9
/100
|
#155
Excellent
2.3%
Immigrants | South America
79.9
/100
|
#156
Good
2.3%
Canadians
79.7
/100
|
#157
Good
2.3%
Immigrants | Senegal
79.4
/100
|
#158
Good
2.3%
Immigrants | West Indies
77.9
/100
|
#159
Good
2.3%

Demographics Similar to Immigrants from the Azores by Single Father Households

In terms of single father households, the demographic groups most similar to Immigrants from the Azores are Hispanic or Latino (2.8%, a difference of 0.16%), Hopi (2.8%, a difference of 0.17%), Mexican American Indian (2.8%, a difference of 0.31%), Apache (2.8%, a difference of 0.35%), and Immigrants from Honduras (2.8%, a difference of 0.63%).
DemographicsRating | RankSingle Father Households
Lumbee
0.0
/100
|
#299
Tragic
2.8%
Kiowa
0.0
/100
|
#300
Tragic
2.8%
Immigrants | Latin America
0.0
/100
|
#301
Tragic
2.8%
Spanish Americans
0.0
/100
|
#302
Tragic
2.8%
Immigrants | Honduras
0.0
/100
|
#303
Tragic
2.8%
Mexican American Indians
0.0
/100
|
#304
Tragic
2.8%
Hispanics or Latinos
0.0
/100
|
#305
Tragic
2.8%
Immigrants | Azores
0.0
/100
|
#306
Tragic
2.8%
Hopi
0.0
/100
|
#307
Tragic
2.8%
Apache
0.0
/100
|
#308
Tragic
2.8%
Central Americans
0.0
/100
|
#309
Tragic
2.9%
Immigrants | Laos
0.0
/100
|
#310
Tragic
2.9%
Spanish American Indians
0.0
/100
|
#311
Tragic
2.9%
Tsimshian
0.0
/100
|
#312
Tragic
2.9%
Arapaho
0.0
/100
|
#313
Tragic
2.9%