Immigrants from Uzbekistan vs South American Indian Family Households with Children

COMPARE

Immigrants from Uzbekistan
Race
Ancestry
AfghanAfricanAlaska NativeAlaskan AthabascanAlbanianAleutAlsatianAmericanApacheArabArapahoArgentineanArmenianAssyrian/Chaldean/SyriacAustralianAustrianBahamianBangladeshiBarbadianBasqueBelgianBelizeanBermudanBhutaneseBlackfeetBolivianBrazilianBritishBritish West IndianBulgarianBurmeseCajunCambodianCanadianCape VerdeanCarpatho RusynCelticCentral AmericanCentral American IndianCherokeeCheyenneChickasawChileanChineseChippewaChoctawColombianColvilleComancheCosta RicanCreeCreekCroatianCrowCubanCypriotCzechCzechoslovakianDanishDelawareDominicanDutchDutch West IndianEastern EuropeanEcuadorianEgyptianEnglishEstonianEthiopianEuropeanFijianFilipinoFinnishFrenchFrench American IndianFrench CanadianGermanGerman RussianGhanaianGreekGuamanian/ChamorroGuatemalanGuyaneseHaitianHmongHonduranHopiHoumaHungarianIcelanderIndian (Asian)IndonesianInupiatIranianIraqiIrishIroquoisIsraeliItalianJamaicanJapaneseJordanianKenyanKiowaKoreanLaotianLatvianLebaneseLiberianLithuanianLumbeeLuxembourgerMacedonianMalaysianMalteseMarshalleseMenomineeMexicanMexican American IndianMongolianMoroccanNative HawaiianNavajoNepaleseNew ZealanderNicaraguanNigerianNorthern EuropeanNorwegianOkinawanOsageOttawaPaiutePakistaniPalestinianPanamanianParaguayanPennsylvania GermanPeruvianPimaPolishPortuguesePotawatomiPuebloPuerto RicanPuget Sound SalishRomanianRussianSalvadoranSamoanScandinavianScotch-IrishScottishSeminoleSenegaleseSerbianShoshoneSierra LeoneanSiouxSlavicSlovakSloveneSomaliSouth AfricanSouth AmericanSoviet UnionSpaniardSpanishSpanish AmericanSpanish American IndianSri LankanSubsaharan AfricanSudaneseSwedishSwissSyrianTaiwaneseThaiTlingit-HaidaTohono O'OdhamTonganTrinidadian and TobagonianTsimshianTurkishU.S. Virgin IslanderUgandanUkrainianUruguayanUteVenezuelanVietnameseWelshWest IndianYakamaYaquiYugoslavianYumanYup'ikZimbabwean
Immigration
NonimmigrantsImmigrantsAfghanistanAfricaAlbaniaArgentinaArmeniaAsiaAustraliaAustriaBahamasBangladeshBarbadosBelarusBelgiumBelizeBoliviaBosnia and HerzegovinaBrazilBulgariaBurma/MyanmarCabo VerdeCambodiaCameroonCanadaCaribbeanCentral AmericaChileChinaColombiaCongoCosta RicaCroatiaCubaCzechoslovakiaDenmarkDominicaDominican RepublicEastern AfricaEastern AsiaEastern EuropeEcuadorEgyptEl SalvadorEnglandEritreaEthiopiaEuropeFijiFranceGermanyGhanaGreeceGrenadaGuatemalaGuyanaHaitiHondurasHong KongHungaryIndiaIndonesiaIranIraqIrelandIsraelItalyJamaicaJapanJordanKazakhstanKenyaKoreaKuwaitLaosLatin AmericaLatviaLebanonLiberiaLithuaniaMalaysiaMexicoMicronesiaMiddle AfricaMoldovaMoroccoNepalNetherlandsNicaraguaNigeriaNorth AmericaNorth MacedoniaNorthern AfricaNorthern EuropeNorwayOceaniaPakistanPanamaPeruPhilippinesPolandPortugalRomaniaRussiaSaudi ArabiaScotlandSenegalSerbiaSierra LeoneSingaporeSomaliaSouth AfricaSouth AmericaSouth Central AsiaSouth Eastern AsiaSouthern EuropeSpainSri LankaSt. Vincent and the GrenadinesSudanSwedenSwitzerlandSyriaTaiwanThailandTrinidad and TobagoTurkeyUgandaUkraineUruguayUzbekistanVenezuelaVietnamWest IndiesWestern AfricaWestern AsiaWestern EuropeYemenZaireZimbabweAzores
South American Indian
Race
Ancestry
AfghanAfricanAlaska NativeAlaskan AthabascanAlbanianAleutAlsatianAmericanApacheArabArapahoArgentineanArmenianAssyrian/Chaldean/SyriacAustralianAustrianBahamianBangladeshiBarbadianBasqueBelgianBelizeanBermudanBhutaneseBlackfeetBolivianBrazilianBritishBritish West IndianBulgarianBurmeseCajunCambodianCanadianCape VerdeanCarpatho RusynCelticCentral AmericanCentral American IndianCherokeeCheyenneChickasawChileanChineseChippewaChoctawColombianColvilleComancheCosta RicanCreeCreekCroatianCrowCubanCypriotCzechCzechoslovakianDanishDelawareDominicanDutchDutch West IndianEastern EuropeanEcuadorianEgyptianEnglishEstonianEthiopianEuropeanFijianFilipinoFinnishFrenchFrench American IndianFrench CanadianGermanGerman RussianGhanaianGreekGuamanian/ChamorroGuatemalanGuyaneseHaitianHmongHonduranHopiHoumaHungarianIcelanderIndian (Asian)IndonesianInupiatIranianIraqiIrishIroquoisIsraeliItalianJamaicanJapaneseJordanianKenyanKiowaKoreanLaotianLatvianLebaneseLiberianLithuanianLumbeeLuxembourgerMacedonianMalaysianMalteseMarshalleseMenomineeMexicanMexican American IndianMongolianMoroccanNative HawaiianNavajoNepaleseNew ZealanderNicaraguanNigerianNorthern EuropeanNorwegianOkinawanOsageOttawaPaiutePakistaniPalestinianPanamanianParaguayanPennsylvania GermanPeruvianPimaPolishPortuguesePotawatomiPuebloPuerto RicanPuget Sound SalishRomanianRussianSalvadoranSamoanScandinavianScotch-IrishScottishSeminoleSenegaleseSerbianShoshoneSierra LeoneanSiouxSlavicSlovakSloveneSomaliSouth AfricanSouth AmericanSouth American IndianSoviet UnionSpaniardSpanishSpanish AmericanSpanish American IndianSri LankanSubsaharan AfricanSudaneseSwedishSwissSyrianTaiwaneseThaiTlingit-HaidaTohono O'OdhamTonganTrinidadian and TobagonianTsimshianTurkishU.S. Virgin IslanderUgandanUkrainianUruguayanUteVenezuelanVietnameseWelshWest IndianYakamaYaquiYugoslavianYumanYup'ikZimbabwean
Immigration
NonimmigrantsImmigrantsAfghanistanAfricaAlbaniaArgentinaArmeniaAsiaAustraliaAustriaBahamasBangladeshBarbadosBelarusBelgiumBelizeBoliviaBosnia and HerzegovinaBrazilBulgariaBurma/MyanmarCabo VerdeCambodiaCameroonCanadaCaribbeanCentral AmericaChileChinaColombiaCongoCosta RicaCroatiaCubaCzechoslovakiaDenmarkDominicaDominican RepublicEastern AfricaEastern AsiaEastern EuropeEcuadorEgyptEl SalvadorEnglandEritreaEthiopiaEuropeFijiFranceGermanyGhanaGreeceGrenadaGuatemalaGuyanaHaitiHondurasHong KongHungaryIndiaIndonesiaIranIraqIrelandIsraelItalyJamaicaJapanJordanKazakhstanKenyaKoreaKuwaitLaosLatin AmericaLatviaLebanonLiberiaLithuaniaMalaysiaMexicoMicronesiaMiddle AfricaMoldovaMoroccoNepalNetherlandsNicaraguaNigeriaNorth AmericaNorth MacedoniaNorthern AfricaNorthern EuropeNorwayOceaniaPakistanPanamaPeruPhilippinesPolandPortugalRomaniaRussiaSaudi ArabiaScotlandSenegalSerbiaSierra LeoneSingaporeSomaliaSouth AfricaSouth AmericaSouth Central AsiaSouth Eastern AsiaSouthern EuropeSpainSri LankaSt. Vincent and the GrenadinesSudanSwedenSwitzerlandSyriaTaiwanThailandTrinidad and TobagoTurkeyUgandaUkraineUruguayVenezuelaVietnamWest IndiesWestern AfricaWestern AsiaWestern EuropeYemenZaireZimbabweAzores
Family Households with Children
Income
Poverty
Unemployment
Labor Participation
Family Structure
Vehicle Availability
Education Level
Disability

Family Households with Children Comparison

Immigrants from Uzbekistan

South American Indians

Tragic
Exceptional
26.7%
FAMILY HOUSEHOLDS WITH CHILDREN
0.9/ 100
METRIC RATING
267th/ 347
METRIC RANK
28.0%
FAMILY HOUSEHOLDS WITH CHILDREN
96.9/ 100
METRIC RATING
114th/ 347
METRIC RANK

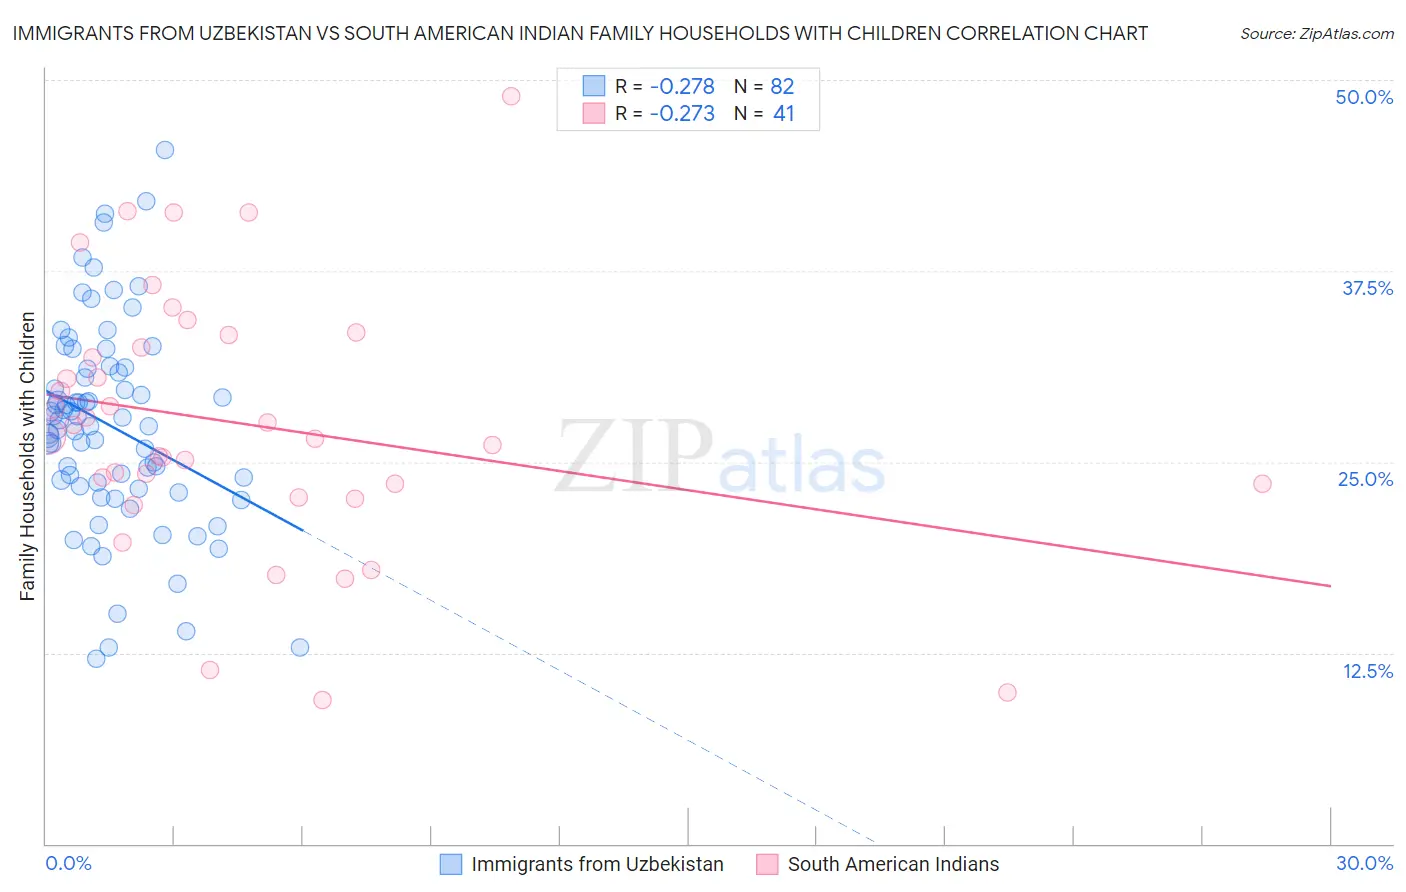
Immigrants from Uzbekistan vs South American Indian Family Households with Children Correlation Chart

The statistical analysis conducted on geographies consisting of 118,662,490 people shows a weak negative correlation between the proportion of Immigrants from Uzbekistan and percentage of family households with children in the United States with a correlation coefficient (R) of -0.278 and weighted average of 26.7%. Similarly, the statistical analysis conducted on geographies consisting of 164,526,695 people shows a weak negative correlation between the proportion of South American Indians and percentage of family households with children in the United States with a correlation coefficient (R) of -0.273 and weighted average of 28.0%, a difference of 4.6%.
Immigrants from Uzbekistan vs South American Indian Family Households with Children

Family Households with Children Correlation Summary

MeasurementImmigrants from UzbekistanSouth American Indian
Minimum12.1%9.4%
Maximum45.4%48.9%
Range33.3%39.5%
Mean27.3%27.5%
Median27.5%26.7%
Interquartile 25% (IQ1)23.4%23.1%
Interquartile 75% (IQ3)31.1%32.9%
Interquartile Range (IQR)7.7%9.8%
Standard Deviation (Sample)6.7%8.5%
Standard Deviation (Population)6.6%8.4%

Similar Demographics by Family Households with Children

Demographics Similar to Immigrants from Uzbekistan by Family Households with Children

In terms of family households with children, the demographic groups most similar to Immigrants from Uzbekistan are Maltese (26.7%, a difference of 0.0%), Taiwanese (26.7%, a difference of 0.010%), Chippewa (26.7%, a difference of 0.010%), Immigrants from Belgium (26.7%, a difference of 0.010%), and Immigrants from Russia (26.8%, a difference of 0.050%).
DemographicsRating | RankFamily Households with Children
Immigrants | Jamaica
1.2
/100
|
#260
Tragic
26.8%
Immigrants | Belarus
1.1
/100
|
#261
Tragic
26.8%
Immigrants | Russia
1.0
/100
|
#262
Tragic
26.8%
Immigrants | North Macedonia
1.0
/100
|
#263
Tragic
26.7%
Taiwanese
0.9
/100
|
#264
Tragic
26.7%
Chippewa
0.9
/100
|
#265
Tragic
26.7%
Maltese
0.9
/100
|
#266
Tragic
26.7%
Immigrants | Uzbekistan
0.9
/100
|
#267
Tragic
26.7%
Immigrants | Belgium
0.9
/100
|
#268
Tragic
26.7%
Immigrants | Denmark
0.8
/100
|
#269
Tragic
26.7%
Immigrants | Zaire
0.7
/100
|
#270
Tragic
26.7%
French
0.7
/100
|
#271
Tragic
26.7%
Somalis
0.7
/100
|
#272
Tragic
26.7%
Immigrants | Hungary
0.6
/100
|
#273
Tragic
26.7%
Eastern Europeans
0.6
/100
|
#274
Tragic
26.7%

Demographics Similar to South American Indians by Family Households with Children

In terms of family households with children, the demographic groups most similar to South American Indians are Immigrants from Africa (28.0%, a difference of 0.010%), Arab (28.0%, a difference of 0.020%), Immigrants from Middle Africa (28.0%, a difference of 0.030%), Scandinavian (28.0%, a difference of 0.050%), and Spaniard (28.0%, a difference of 0.12%).
DemographicsRating | RankFamily Households with Children
Immigrants | Uganda
97.7
/100
|
#107
Exceptional
28.0%
Immigrants | Burma/Myanmar
97.7
/100
|
#108
Exceptional
28.0%
Tohono O'odham
97.6
/100
|
#109
Exceptional
28.0%
Spaniards
97.4
/100
|
#110
Exceptional
28.0%
Scandinavians
97.1
/100
|
#111
Exceptional
28.0%
Immigrants | Middle Africa
97.0
/100
|
#112
Exceptional
28.0%
Arabs
97.0
/100
|
#113
Exceptional
28.0%
South American Indians
96.9
/100
|
#114
Exceptional
28.0%
Immigrants | Africa
96.8
/100
|
#115
Exceptional
28.0%
Pakistanis
96.0
/100
|
#116
Exceptional
27.9%
Immigrants | Malaysia
95.9
/100
|
#117
Exceptional
27.9%
Central American Indians
95.9
/100
|
#118
Exceptional
27.9%
Zimbabweans
95.6
/100
|
#119
Exceptional
27.9%
Europeans
95.4
/100
|
#120
Exceptional
27.9%
Immigrants | Western Asia
93.6
/100
|
#121
Exceptional
27.9%