Immigrants from Ukraine vs Welsh Currently Married
COMPARE
Immigrants from Ukraine
Welsh
Currently Married
Currently Married Comparison
Immigrants from Ukraine
Welsh
47.9%
CURRENTLY MARRIED
94.8/ 100
METRIC RATING
97th/ 347
METRIC RANK
48.9%
CURRENTLY MARRIED
99.5/ 100
METRIC RATING
28th/ 347
METRIC RANK
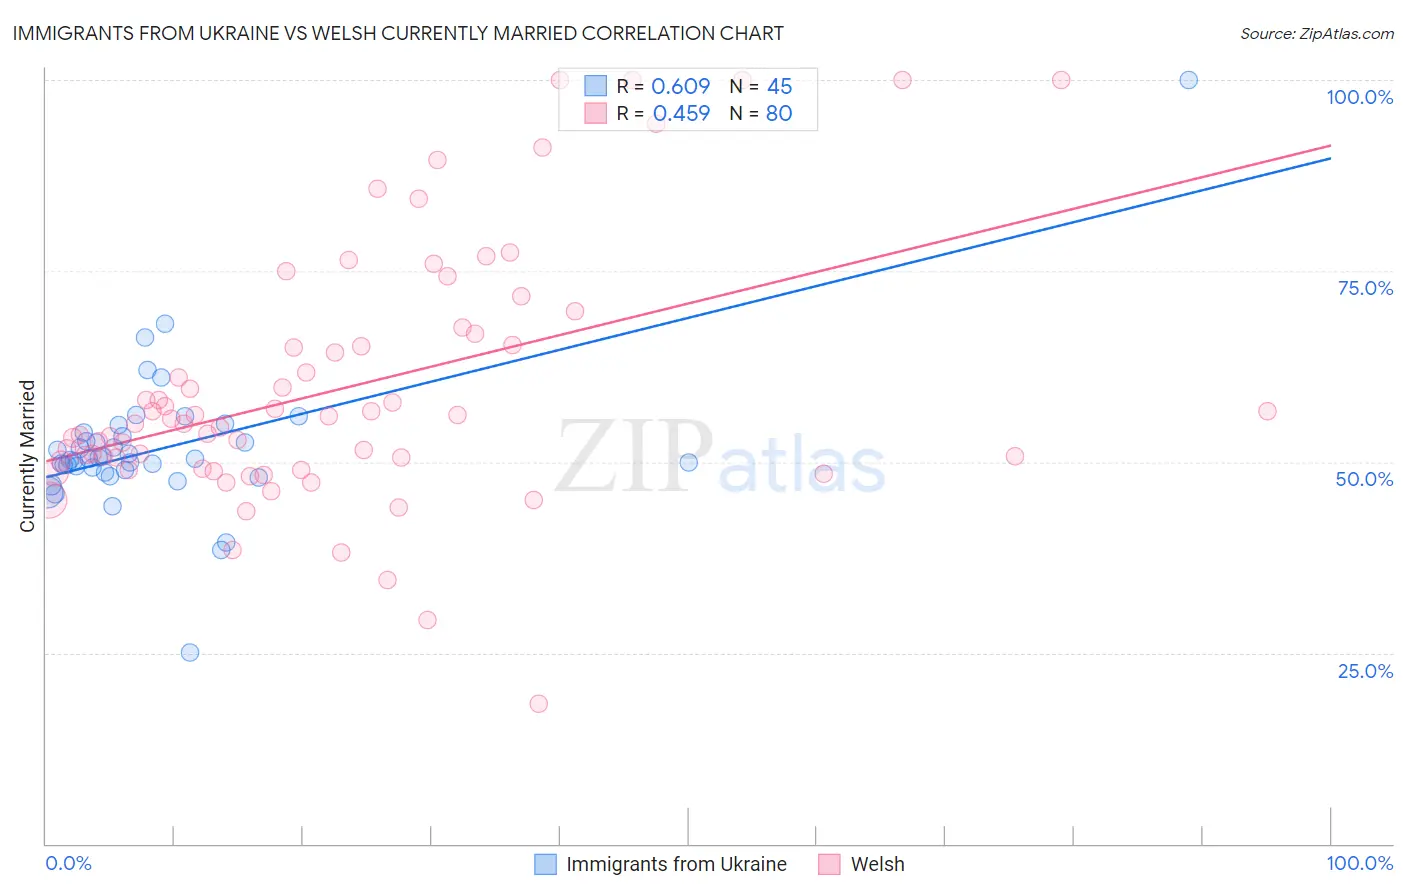
Immigrants from Ukraine vs Welsh Currently Married Correlation Chart
The statistical analysis conducted on geographies consisting of 289,694,818 people shows a significant positive correlation between the proportion of Immigrants from Ukraine and percentage of population currently married in the United States with a correlation coefficient (R) of 0.609 and weighted average of 47.9%. Similarly, the statistical analysis conducted on geographies consisting of 528,516,985 people shows a moderate positive correlation between the proportion of Welsh and percentage of population currently married in the United States with a correlation coefficient (R) of 0.459 and weighted average of 48.9%, a difference of 2.2%.
Currently Married Correlation Summary
| Measurement | Immigrants from Ukraine | Welsh |
| Minimum | 25.0% | 18.4% |
| Maximum | 100.0% | 100.0% |
| Range | 75.0% | 81.6% |
| Mean | 51.9% | 59.7% |
| Median | 50.5% | 55.4% |
| Interquartile 25% (IQ1) | 48.7% | 49.6% |
| Interquartile 75% (IQ3) | 53.6% | 66.0% |
| Interquartile Range (IQR) | 4.9% | 16.4% |
| Standard Deviation (Sample) | 10.0% | 16.8% |
| Standard Deviation (Population) | 9.9% | 16.7% |
Similar Demographics by Currently Married
Demographics Similar to Immigrants from Ukraine by Currently Married
In terms of currently married, the demographic groups most similar to Immigrants from Ukraine are Immigrants from Bulgaria (47.9%, a difference of 0.010%), Egyptian (47.9%, a difference of 0.010%), Immigrants from China (47.9%, a difference of 0.020%), Native Hawaiian (47.9%, a difference of 0.040%), and Lebanese (47.9%, a difference of 0.060%).
| Demographics | Rating | Rank | Currently Married |
| Americans | 95.7 /100 | #90 | Exceptional 48.0% |
| Immigrants | Bolivia | 95.6 /100 | #91 | Exceptional 47.9% |
| Koreans | 95.4 /100 | #92 | Exceptional 47.9% |
| Lebanese | 95.1 /100 | #93 | Exceptional 47.9% |
| Native Hawaiians | 95.0 /100 | #94 | Exceptional 47.9% |
| Immigrants | Bulgaria | 94.8 /100 | #95 | Exceptional 47.9% |
| Egyptians | 94.8 /100 | #96 | Exceptional 47.9% |
| Immigrants | Ukraine | 94.8 /100 | #97 | Exceptional 47.9% |
| Immigrants | China | 94.7 /100 | #98 | Exceptional 47.9% |
| Immigrants | Sweden | 94.3 /100 | #99 | Exceptional 47.8% |
| Celtics | 94.2 /100 | #100 | Exceptional 47.8% |
| Immigrants | Germany | 94.1 /100 | #101 | Exceptional 47.8% |
| Turks | 93.9 /100 | #102 | Exceptional 47.8% |
| Cypriots | 93.7 /100 | #103 | Exceptional 47.8% |
| Serbians | 93.6 /100 | #104 | Exceptional 47.8% |
Demographics Similar to Welsh by Currently Married
In terms of currently married, the demographic groups most similar to Welsh are Burmese (48.9%, a difference of 0.040%), Croatian (48.9%, a difference of 0.050%), Eastern European (48.9%, a difference of 0.060%), Polish (48.9%, a difference of 0.060%), and Immigrants from Hong Kong (48.9%, a difference of 0.070%).
| Demographics | Rating | Rank | Currently Married |
| Scottish | 99.8 /100 | #21 | Exceptional 49.2% |
| Bulgarians | 99.7 /100 | #22 | Exceptional 49.1% |
| Immigrants | Pakistan | 99.7 /100 | #23 | Exceptional 49.1% |
| Lithuanians | 99.6 /100 | #24 | Exceptional 49.0% |
| Maltese | 99.6 /100 | #25 | Exceptional 49.0% |
| Immigrants | Korea | 99.6 /100 | #26 | Exceptional 49.0% |
| Burmese | 99.6 /100 | #27 | Exceptional 48.9% |
| Welsh | 99.5 /100 | #28 | Exceptional 48.9% |
| Croatians | 99.5 /100 | #29 | Exceptional 48.9% |
| Eastern Europeans | 99.5 /100 | #30 | Exceptional 48.9% |
| Poles | 99.5 /100 | #31 | Exceptional 48.9% |
| Immigrants | Hong Kong | 99.5 /100 | #32 | Exceptional 48.9% |
| Irish | 99.5 /100 | #33 | Exceptional 48.9% |
| Immigrants | Lithuania | 99.4 /100 | #34 | Exceptional 48.8% |
| Immigrants | Northern Europe | 99.4 /100 | #35 | Exceptional 48.8% |