Immigrants from Uganda vs Assyrian/Chaldean/Syriac Divorced or Separated

COMPARE

Immigrants from Uganda
Race
Ancestry
AfghanAfricanAlaska NativeAlaskan AthabascanAlbanianAleutAlsatianAmericanApacheArabArapahoArgentineanArmenianAustralianAustrianBahamianBangladeshiBarbadianBasqueBelgianBelizeanBermudanBhutaneseBlackfeetBolivianBrazilianBritishBritish West IndianBulgarianBurmeseCajunCambodianCanadianCape VerdeanCarpatho RusynCelticCentral AmericanCentral American IndianCherokeeCheyenneChickasawChileanChineseChippewaChoctawColombianColvilleComancheCosta RicanCreeCreekCroatianCrowCubanCypriotCzechCzechoslovakianDanishDelawareDominicanDutchDutch West IndianEastern EuropeanEcuadorianEgyptianEnglishEstonianEthiopianEuropeanFijianFilipinoFinnishFrenchFrench American IndianFrench CanadianGermanGerman RussianGhanaianGreekGuamanian/ChamorroGuatemalanGuyaneseHaitianHmongHonduranHopiHoumaHungarianIcelanderIndian (Asian)IndonesianInupiatIranianIraqiIrishIroquoisIsraeliItalianJamaicanJapaneseJordanianKenyanKiowaKoreanLaotianLatvianLebaneseLiberianLithuanianLumbeeLuxembourgerMacedonianMalaysianMalteseMarshalleseMenomineeMexicanMexican American IndianMongolianMoroccanNative HawaiianNavajoNepaleseNew ZealanderNicaraguanNigerianNorthern EuropeanNorwegianOkinawanOsageOttawaPaiutePakistaniPalestinianPanamanianParaguayanPennsylvania GermanPeruvianPimaPolishPortuguesePotawatomiPuebloPuerto RicanPuget Sound SalishRomanianRussianSalvadoranSamoanScandinavianScotch-IrishScottishSeminoleSenegaleseSerbianShoshoneSierra LeoneanSiouxSlavicSlovakSloveneSomaliSouth AfricanSouth AmericanSouth American IndianSoviet UnionSpaniardSpanishSpanish AmericanSpanish American IndianSri LankanSubsaharan AfricanSudaneseSwedishSwissSyrianTaiwaneseThaiTlingit-HaidaTohono O'OdhamTonganTrinidadian and TobagonianTsimshianTurkishU.S. Virgin IslanderUgandanUkrainianUruguayanUteVenezuelanVietnameseWelshWest IndianYakamaYaquiYugoslavianYumanYup'ikZimbabwean
Immigration
NonimmigrantsImmigrantsAfghanistanAfricaAlbaniaArgentinaArmeniaAsiaAustraliaAustriaBahamasBangladeshBarbadosBelarusBelgiumBelizeBoliviaBosnia and HerzegovinaBrazilBulgariaBurma/MyanmarCabo VerdeCambodiaCameroonCanadaCaribbeanCentral AmericaChileChinaColombiaCongoCosta RicaCroatiaCubaCzechoslovakiaDenmarkDominicaDominican RepublicEastern AfricaEastern AsiaEastern EuropeEcuadorEgyptEl SalvadorEnglandEritreaEthiopiaEuropeFijiFranceGermanyGhanaGreeceGrenadaGuatemalaGuyanaHaitiHondurasHong KongHungaryIndiaIndonesiaIranIraqIrelandIsraelItalyJamaicaJapanJordanKazakhstanKenyaKoreaKuwaitLaosLatin AmericaLatviaLebanonLiberiaLithuaniaMalaysiaMexicoMicronesiaMiddle AfricaMoldovaMoroccoNepalNetherlandsNicaraguaNigeriaNorth AmericaNorth MacedoniaNorthern AfricaNorthern EuropeNorwayOceaniaPakistanPanamaPeruPhilippinesPolandPortugalRomaniaRussiaSaudi ArabiaScotlandSenegalSerbiaSierra LeoneSingaporeSomaliaSouth AfricaSouth AmericaSouth Central AsiaSouth Eastern AsiaSouthern EuropeSpainSri LankaSt. Vincent and the GrenadinesSudanSwedenSwitzerlandSyriaTaiwanThailandTrinidad and TobagoTurkeyUgandaUkraineUruguayUzbekistanVenezuelaVietnamWest IndiesWestern AfricaWestern AsiaWestern EuropeYemenZaireZimbabweAzores
Assyrian/Chaldean/Syriac
Race
Ancestry
AfghanAfricanAlaska NativeAlaskan AthabascanAlbanianAleutAlsatianAmericanApacheArabArapahoArgentineanArmenianAssyrian/Chaldean/SyriacAustralianAustrianBahamianBangladeshiBarbadianBasqueBelgianBelizeanBermudanBhutaneseBlackfeetBolivianBrazilianBritishBritish West IndianBulgarianBurmeseCajunCambodianCanadianCape VerdeanCarpatho RusynCelticCentral AmericanCentral American IndianCherokeeCheyenneChickasawChileanChineseChippewaChoctawColombianColvilleComancheCosta RicanCreeCreekCroatianCrowCubanCypriotCzechCzechoslovakianDanishDelawareDominicanDutchDutch West IndianEastern EuropeanEcuadorianEgyptianEnglishEstonianEthiopianEuropeanFijianFilipinoFinnishFrenchFrench American IndianFrench CanadianGermanGerman RussianGhanaianGreekGuamanian/ChamorroGuatemalanGuyaneseHaitianHmongHonduranHopiHoumaHungarianIcelanderIndian (Asian)IndonesianInupiatIranianIraqiIrishIroquoisIsraeliItalianJamaicanJapaneseJordanianKenyanKiowaKoreanLaotianLatvianLebaneseLiberianLithuanianLumbeeLuxembourgerMacedonianMalaysianMalteseMarshalleseMenomineeMexicanMexican American IndianMongolianMoroccanNative HawaiianNavajoNepaleseNew ZealanderNicaraguanNigerianNorthern EuropeanNorwegianOkinawanOsageOttawaPaiutePakistaniPalestinianPanamanianParaguayanPennsylvania GermanPeruvianPimaPolishPortuguesePotawatomiPuebloPuerto RicanPuget Sound SalishRomanianRussianSalvadoranSamoanScandinavianScotch-IrishScottishSeminoleSenegaleseSerbianShoshoneSierra LeoneanSiouxSlavicSlovakSloveneSomaliSouth AfricanSouth AmericanSouth American IndianSoviet UnionSpaniardSpanishSpanish AmericanSpanish American IndianSri LankanSubsaharan AfricanSudaneseSwedishSwissSyrianTaiwaneseThaiTlingit-HaidaTohono O'OdhamTonganTrinidadian and TobagonianTsimshianTurkishU.S. Virgin IslanderUgandanUkrainianUruguayanUteVenezuelanVietnameseWelshWest IndianYakamaYaquiYugoslavianYumanYup'ikZimbabwean
Immigration
NonimmigrantsImmigrantsAfghanistanAfricaAlbaniaArgentinaArmeniaAsiaAustraliaAustriaBahamasBangladeshBarbadosBelarusBelgiumBelizeBoliviaBosnia and HerzegovinaBrazilBulgariaBurma/MyanmarCabo VerdeCambodiaCameroonCanadaCaribbeanCentral AmericaChileChinaColombiaCongoCosta RicaCroatiaCubaCzechoslovakiaDenmarkDominicaDominican RepublicEastern AfricaEastern AsiaEastern EuropeEcuadorEgyptEl SalvadorEnglandEritreaEthiopiaEuropeFijiFranceGermanyGhanaGreeceGrenadaGuatemalaGuyanaHaitiHondurasHong KongHungaryIndiaIndonesiaIranIraqIrelandIsraelItalyJamaicaJapanJordanKazakhstanKenyaKoreaKuwaitLaosLatin AmericaLatviaLebanonLiberiaLithuaniaMalaysiaMexicoMicronesiaMiddle AfricaMoldovaMoroccoNepalNetherlandsNicaraguaNigeriaNorth AmericaNorth MacedoniaNorthern AfricaNorthern EuropeNorwayOceaniaPakistanPanamaPeruPhilippinesPolandPortugalRomaniaRussiaSaudi ArabiaScotlandSenegalSerbiaSierra LeoneSingaporeSomaliaSouth AfricaSouth AmericaSouth Central AsiaSouth Eastern AsiaSouthern EuropeSpainSri LankaSt. Vincent and the GrenadinesSudanSwedenSwitzerlandSyriaTaiwanThailandTrinidad and TobagoTurkeyUkraineUruguayUzbekistanVenezuelaVietnamWest IndiesWestern AfricaWestern AsiaWestern EuropeYemenZaireZimbabweAzores
Divorced or Separated
Income
Poverty
Unemployment
Labor Participation
Family Structure
Vehicle Availability
Education Level
Disability

Divorced or Separated Comparison

Immigrants from Uganda

Assyrians/Chaldeans/Syriacs

Exceptional
Exceptional
11.7%
DIVORCED OR SEPARATED
95.3/ 100
METRIC RATING
117th/ 347
METRIC RANK
10.6%
DIVORCED OR SEPARATED
100.0/ 100
METRIC RATING
14th/ 347
METRIC RANK

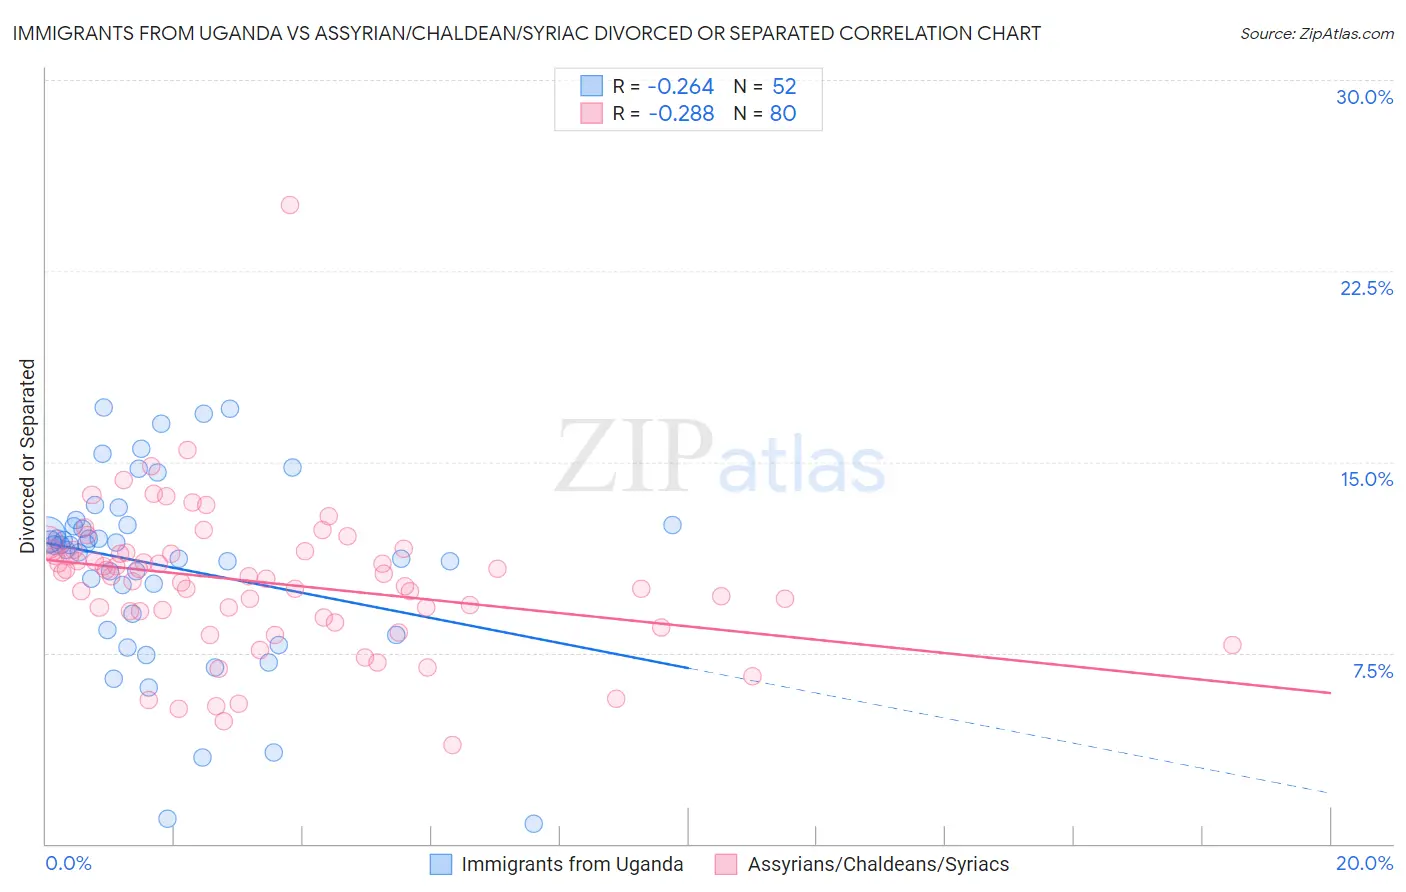
Immigrants from Uganda vs Assyrian/Chaldean/Syriac Divorced or Separated Correlation Chart

The statistical analysis conducted on geographies consisting of 125,976,445 people shows a weak negative correlation between the proportion of Immigrants from Uganda and percentage of population currently divorced or separated in the United States with a correlation coefficient (R) of -0.264 and weighted average of 11.7%. Similarly, the statistical analysis conducted on geographies consisting of 110,313,686 people shows a weak negative correlation between the proportion of Assyrians/Chaldeans/Syriacs and percentage of population currently divorced or separated in the United States with a correlation coefficient (R) of -0.288 and weighted average of 10.6%, a difference of 11.2%.
Immigrants from Uganda vs Assyrian/Chaldean/Syriac Divorced or Separated

Divorced or Separated Correlation Summary

MeasurementImmigrants from UgandaAssyrian/Chaldean/Syriac
Minimum0.80%3.9%
Maximum17.2%25.1%
Range16.4%21.2%
Mean10.9%10.3%
Median11.7%10.5%
Interquartile 25% (IQ1)8.7%9.0%
Interquartile 75% (IQ3)12.5%11.5%
Interquartile Range (IQR)3.8%2.5%
Standard Deviation (Sample)3.7%2.9%
Standard Deviation (Population)3.7%2.9%

Similar Demographics by Divorced or Separated

Demographics Similar to Immigrants from Uganda by Divorced or Separated

In terms of divorced or separated, the demographic groups most similar to Immigrants from Uganda are Ecuadorian (11.7%, a difference of 0.0%), Immigrants from Iraq (11.7%, a difference of 0.020%), Syrian (11.7%, a difference of 0.050%), Lithuanian (11.7%, a difference of 0.080%), and Immigrants from Norway (11.7%, a difference of 0.13%).
DemographicsRating | RankDivorced or Separated
Immigrants | Czechoslovakia
96.9
/100
|
#110
Exceptional
11.7%
Immigrants | Spain
96.8
/100
|
#111
Exceptional
11.7%
Immigrants | France
96.6
/100
|
#112
Exceptional
11.7%
Estonians
96.6
/100
|
#113
Exceptional
11.7%
Immigrants | Norway
95.9
/100
|
#114
Exceptional
11.7%
Lithuanians
95.7
/100
|
#115
Exceptional
11.7%
Immigrants | Iraq
95.4
/100
|
#116
Exceptional
11.7%
Immigrants | Uganda
95.3
/100
|
#117
Exceptional
11.7%
Ecuadorians
95.3
/100
|
#118
Exceptional
11.7%
Syrians
95.1
/100
|
#119
Exceptional
11.7%
Iraqis
94.6
/100
|
#120
Exceptional
11.8%
Romanians
94.5
/100
|
#121
Exceptional
11.8%
Menominee
93.8
/100
|
#122
Exceptional
11.8%
Immigrants | Immigrants
93.7
/100
|
#123
Exceptional
11.8%
Ugandans
93.1
/100
|
#124
Exceptional
11.8%

Demographics Similar to Assyrians/Chaldeans/Syriacs by Divorced or Separated

In terms of divorced or separated, the demographic groups most similar to Assyrians/Chaldeans/Syriacs are Immigrants from Armenia (10.6%, a difference of 0.070%), Immigrants from Korea (10.6%, a difference of 0.51%), Immigrants from Israel (10.6%, a difference of 0.62%), Immigrants from Iran (10.6%, a difference of 0.70%), and Asian (10.6%, a difference of 0.71%).
DemographicsRating | RankDivorced or Separated
Thais
100.0
/100
|
#7
Exceptional
10.2%
Immigrants | Eastern Asia
100.0
/100
|
#8
Exceptional
10.2%
Yup'ik
100.0
/100
|
#9
Exceptional
10.3%
Immigrants | Singapore
100.0
/100
|
#10
Exceptional
10.3%
Immigrants | South Central Asia
100.0
/100
|
#11
Exceptional
10.4%
Okinawans
100.0
/100
|
#12
Exceptional
10.5%
Cypriots
100.0
/100
|
#13
Exceptional
10.5%
Assyrians/Chaldeans/Syriacs
100.0
/100
|
#14
Exceptional
10.6%
Immigrants | Armenia
100.0
/100
|
#15
Exceptional
10.6%
Immigrants | Korea
100.0
/100
|
#16
Exceptional
10.6%
Immigrants | Israel
100.0
/100
|
#17
Exceptional
10.6%
Immigrants | Iran
100.0
/100
|
#18
Exceptional
10.6%
Asians
100.0
/100
|
#19
Exceptional
10.6%
Burmese
100.0
/100
|
#20
Exceptional
10.7%
Immigrants | Asia
100.0
/100
|
#21
Exceptional
10.7%