Immigrants from Trinidad and Tobago vs Honduran Currently Married
COMPARE
Immigrants from Trinidad and Tobago
Honduran
Currently Married
Currently Married Comparison
Immigrants from Trinidad and Tobago
Hondurans
41.9%
CURRENTLY MARRIED
0.0/ 100
METRIC RATING
305th/ 347
METRIC RANK
42.5%
CURRENTLY MARRIED
0.0/ 100
METRIC RATING
294th/ 347
METRIC RANK
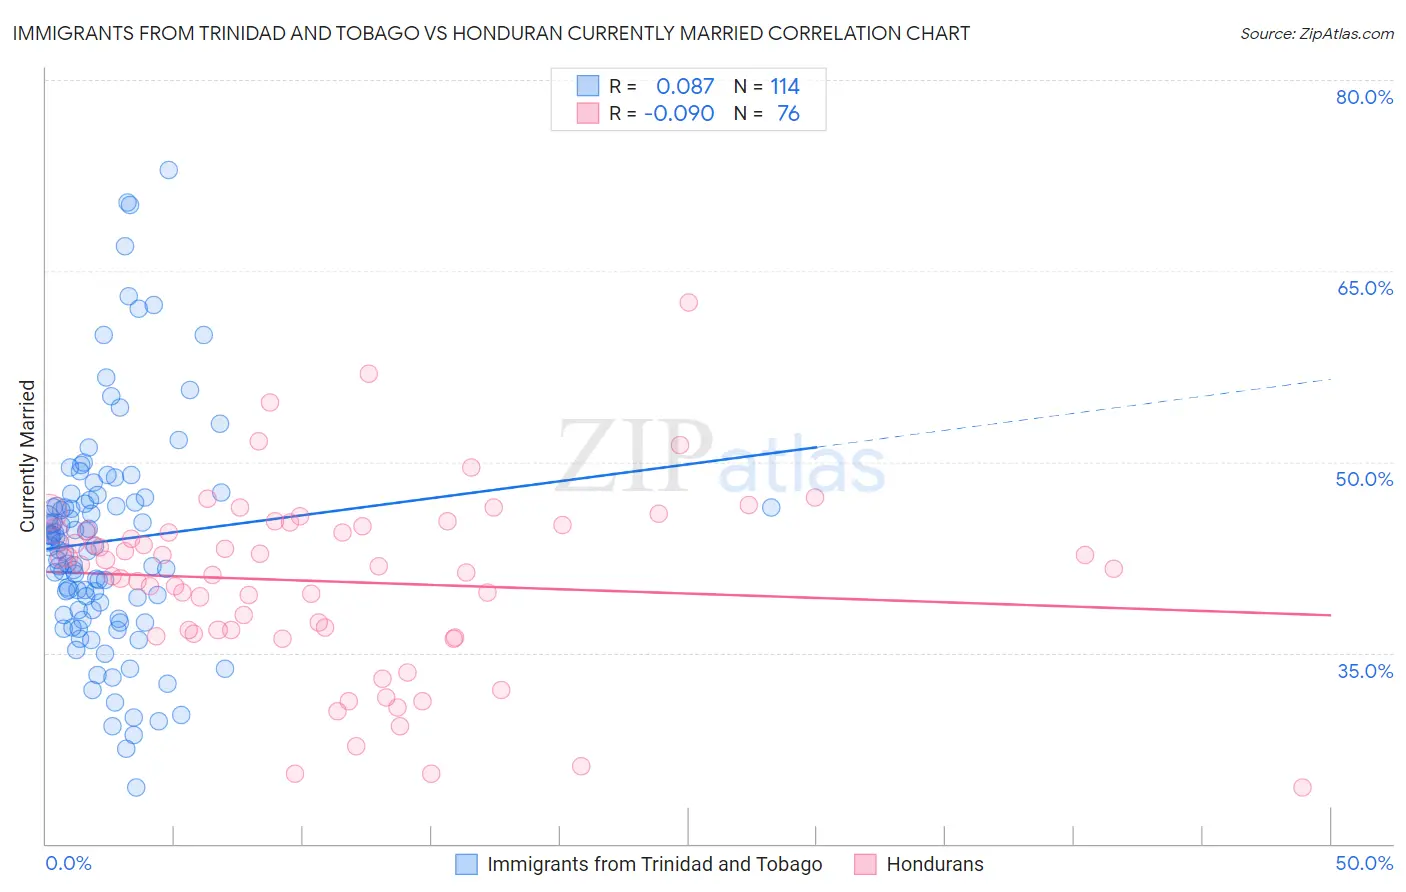
Immigrants from Trinidad and Tobago vs Honduran Currently Married Correlation Chart
The statistical analysis conducted on geographies consisting of 223,527,783 people shows a slight positive correlation between the proportion of Immigrants from Trinidad and Tobago and percentage of population currently married in the United States with a correlation coefficient (R) of 0.087 and weighted average of 41.9%. Similarly, the statistical analysis conducted on geographies consisting of 357,812,977 people shows a slight negative correlation between the proportion of Hondurans and percentage of population currently married in the United States with a correlation coefficient (R) of -0.090 and weighted average of 42.5%, a difference of 1.5%.
Currently Married Correlation Summary
| Measurement | Immigrants from Trinidad and Tobago | Honduran |
| Minimum | 24.4% | 24.4% |
| Maximum | 72.9% | 62.5% |
| Range | 48.5% | 38.1% |
| Mean | 43.8% | 40.6% |
| Median | 43.4% | 41.7% |
| Interquartile 25% (IQ1) | 38.3% | 36.6% |
| Interquartile 75% (IQ3) | 47.0% | 44.7% |
| Interquartile Range (IQR) | 8.7% | 8.1% |
| Standard Deviation (Sample) | 8.9% | 7.1% |
| Standard Deviation (Population) | 8.9% | 7.1% |
Demographics Similar to Immigrants from Trinidad and Tobago and Hondurans by Currently Married
In terms of currently married, the demographic groups most similar to Immigrants from Trinidad and Tobago are Immigrants from Guyana (41.9%, a difference of 0.010%), Immigrants from Bahamas (41.9%, a difference of 0.030%), African (41.8%, a difference of 0.14%), Sioux (41.9%, a difference of 0.15%), and Immigrants from Zaire (42.0%, a difference of 0.16%). Similarly, the demographic groups most similar to Hondurans are Yuman (42.6%, a difference of 0.12%), Subsaharan African (42.6%, a difference of 0.14%), Immigrants from Guatemala (42.6%, a difference of 0.30%), Immigrants from Western Africa (42.4%, a difference of 0.33%), and Immigrants from Ghana (42.7%, a difference of 0.41%).
| Demographics | Rating | Rank | Currently Married |
| Paiute | 0.0 /100 | #289 | Tragic 42.7% |
| Immigrants | Ghana | 0.0 /100 | #290 | Tragic 42.7% |
| Immigrants | Guatemala | 0.0 /100 | #291 | Tragic 42.6% |
| Sub-Saharan Africans | 0.0 /100 | #292 | Tragic 42.6% |
| Yuman | 0.0 /100 | #293 | Tragic 42.6% |
| Hondurans | 0.0 /100 | #294 | Tragic 42.5% |
| Immigrants | Western Africa | 0.0 /100 | #295 | Tragic 42.4% |
| Menominee | 0.0 /100 | #296 | Tragic 42.3% |
| Cheyenne | 0.0 /100 | #297 | Tragic 42.2% |
| Immigrants | Honduras | 0.0 /100 | #298 | Tragic 42.2% |
| Liberians | 0.0 /100 | #299 | Tragic 42.2% |
| Belizeans | 0.0 /100 | #300 | Tragic 42.2% |
| Immigrants | Yemen | 0.0 /100 | #301 | Tragic 42.1% |
| Immigrants | Zaire | 0.0 /100 | #302 | Tragic 42.0% |
| Sioux | 0.0 /100 | #303 | Tragic 41.9% |
| Immigrants | Bahamas | 0.0 /100 | #304 | Tragic 41.9% |
| Immigrants | Trinidad and Tobago | 0.0 /100 | #305 | Tragic 41.9% |
| Immigrants | Guyana | 0.0 /100 | #306 | Tragic 41.9% |
| Africans | 0.0 /100 | #307 | Tragic 41.8% |
| Immigrants | Belize | 0.0 /100 | #308 | Tragic 41.8% |
| Immigrants | Liberia | 0.0 /100 | #309 | Tragic 41.8% |