Immigrants from Taiwan vs Apache Average Family Size
COMPARE
Immigrants from Taiwan
Apache
Average Family Size
Average Family Size Comparison
Immigrants from Taiwan
Apache
3.24
AVERAGE FAMILY SIZE
68.1/ 100
METRIC RATING
156th/ 347
METRIC RANK
3.46
AVERAGE FAMILY SIZE
100.0/ 100
METRIC RATING
22nd/ 347
METRIC RANK
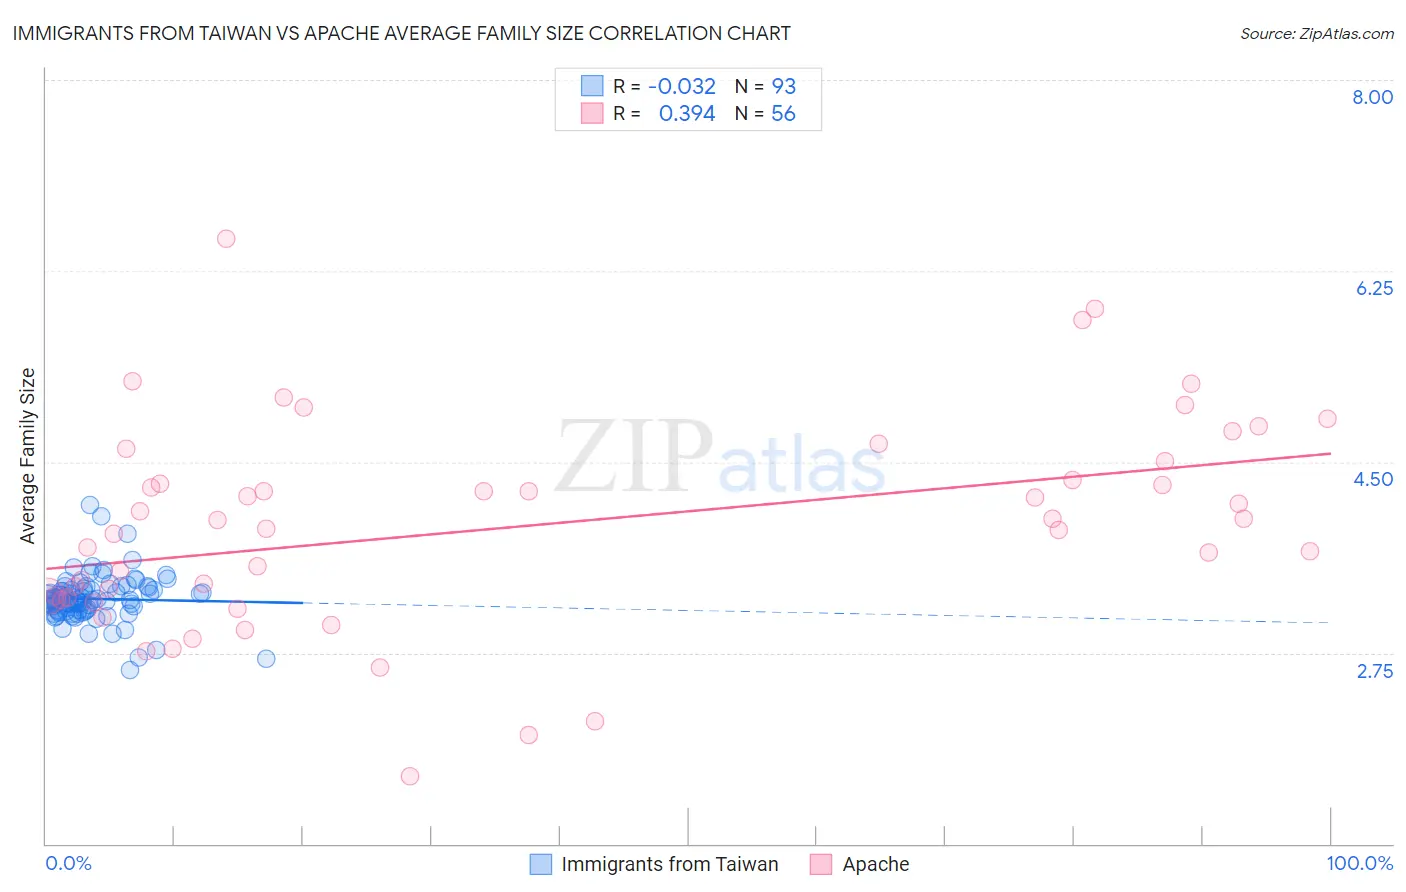
Immigrants from Taiwan vs Apache Average Family Size Correlation Chart
The statistical analysis conducted on geographies consisting of 298,119,083 people shows no correlation between the proportion of Immigrants from Taiwan and average family size in the United States with a correlation coefficient (R) of -0.032 and weighted average of 3.24. Similarly, the statistical analysis conducted on geographies consisting of 231,040,944 people shows a mild positive correlation between the proportion of Apache and average family size in the United States with a correlation coefficient (R) of 0.394 and weighted average of 3.46, a difference of 6.9%.
Average Family Size Correlation Summary
| Measurement | Immigrants from Taiwan | Apache |
| Minimum | 2.59 | 1.62 |
| Maximum | 4.10 | 6.54 |
| Range | 1.51 | 4.92 |
| Mean | 3.24 | 3.91 |
| Median | 3.23 | 3.93 |
| Interquartile 25% (IQ1) | 3.14 | 3.27 |
| Interquartile 75% (IQ3) | 3.33 | 4.42 |
| Interquartile Range (IQR) | 0.20 | 1.15 |
| Standard Deviation (Sample) | 0.22 | 0.96 |
| Standard Deviation (Population) | 0.22 | 0.96 |
Similar Demographics by Average Family Size
Demographics Similar to Immigrants from Taiwan by Average Family Size
In terms of average family size, the demographic groups most similar to Immigrants from Taiwan are Seminole (3.24, a difference of 0.0%), Immigrants from Uzbekistan (3.24, a difference of 0.020%), Immigrants from Egypt (3.24, a difference of 0.040%), Immigrants from Eritrea (3.24, a difference of 0.070%), and Iraqi (3.24, a difference of 0.080%).
| Demographics | Rating | Rank | Average Family Size |
| Assyrians/Chaldeans/Syriacs | 73.8 /100 | #149 | Good 3.24 |
| Indians (Asian) | 73.6 /100 | #150 | Good 3.24 |
| Jordanians | 73.5 /100 | #151 | Good 3.24 |
| Spanish Americans | 72.5 /100 | #152 | Good 3.24 |
| Immigrants | Eritrea | 71.4 /100 | #153 | Good 3.24 |
| Immigrants | Egypt | 70.0 /100 | #154 | Good 3.24 |
| Seminole | 68.2 /100 | #155 | Good 3.24 |
| Immigrants | Taiwan | 68.1 /100 | #156 | Good 3.24 |
| Immigrants | Uzbekistan | 67.0 /100 | #157 | Good 3.24 |
| Iraqis | 64.3 /100 | #158 | Good 3.24 |
| Ethiopians | 63.9 /100 | #159 | Good 3.24 |
| Immigrants | Iraq | 63.7 /100 | #160 | Good 3.24 |
| Immigrants | Chile | 63.2 /100 | #161 | Good 3.24 |
| Immigrants | Uganda | 60.1 /100 | #162 | Good 3.23 |
| Uruguayans | 58.8 /100 | #163 | Average 3.23 |
Demographics Similar to Apache by Average Family Size
In terms of average family size, the demographic groups most similar to Apache are Yuman (3.47, a difference of 0.060%), Immigrants from Fiji (3.45, a difference of 0.29%), Cheyenne (3.47, a difference of 0.31%), Mexican (3.48, a difference of 0.35%), and Native/Alaskan (3.45, a difference of 0.41%).
| Demographics | Rating | Rank | Average Family Size |
| Tongans | 100.0 /100 | #15 | Exceptional 3.49 |
| Ute | 100.0 /100 | #16 | Exceptional 3.49 |
| Immigrants | El Salvador | 100.0 /100 | #17 | Exceptional 3.49 |
| Salvadorans | 100.0 /100 | #18 | Exceptional 3.48 |
| Mexicans | 100.0 /100 | #19 | Exceptional 3.48 |
| Cheyenne | 100.0 /100 | #20 | Exceptional 3.47 |
| Yuman | 100.0 /100 | #21 | Exceptional 3.47 |
| Apache | 100.0 /100 | #22 | Exceptional 3.46 |
| Immigrants | Fiji | 100.0 /100 | #23 | Exceptional 3.45 |
| Natives/Alaskans | 100.0 /100 | #24 | Exceptional 3.45 |
| Yakama | 100.0 /100 | #25 | Exceptional 3.45 |
| Native Hawaiians | 100.0 /100 | #26 | Exceptional 3.43 |
| Mexican American Indians | 100.0 /100 | #27 | Exceptional 3.43 |
| Immigrants | Latin America | 100.0 /100 | #28 | Exceptional 3.42 |
| Nepalese | 100.0 /100 | #29 | Exceptional 3.42 |