Immigrants from St. Vincent and the Grenadines vs Ugandan Family Households with Children

COMPARE

Immigrants from St. Vincent and the Grenadines
Race
Ancestry
AfghanAfricanAlaska NativeAlaskan AthabascanAlbanianAleutAlsatianAmericanApacheArabArapahoArgentineanArmenianAssyrian/Chaldean/SyriacAustralianAustrianBahamianBangladeshiBarbadianBasqueBelgianBelizeanBermudanBhutaneseBlackfeetBolivianBrazilianBritishBritish West IndianBulgarianBurmeseCajunCambodianCanadianCape VerdeanCarpatho RusynCelticCentral AmericanCentral American IndianCherokeeCheyenneChickasawChileanChineseChippewaChoctawColombianColvilleComancheCosta RicanCreeCreekCroatianCrowCubanCypriotCzechCzechoslovakianDanishDelawareDominicanDutchDutch West IndianEastern EuropeanEcuadorianEgyptianEnglishEstonianEthiopianEuropeanFijianFilipinoFinnishFrenchFrench American IndianFrench CanadianGermanGerman RussianGhanaianGreekGuamanian/ChamorroGuatemalanGuyaneseHaitianHmongHonduranHopiHoumaHungarianIcelanderIndian (Asian)IndonesianInupiatIranianIraqiIrishIroquoisIsraeliItalianJamaicanJapaneseJordanianKenyanKiowaKoreanLaotianLatvianLebaneseLiberianLithuanianLumbeeLuxembourgerMacedonianMalaysianMalteseMarshalleseMenomineeMexicanMexican American IndianMongolianMoroccanNative HawaiianNavajoNepaleseNew ZealanderNicaraguanNigerianNorthern EuropeanNorwegianOkinawanOsageOttawaPaiutePakistaniPalestinianPanamanianParaguayanPennsylvania GermanPeruvianPimaPolishPortuguesePotawatomiPuebloPuerto RicanPuget Sound SalishRomanianRussianSalvadoranSamoanScandinavianScotch-IrishScottishSeminoleSenegaleseSerbianShoshoneSierra LeoneanSiouxSlavicSlovakSloveneSomaliSouth AfricanSouth AmericanSouth American IndianSoviet UnionSpaniardSpanishSpanish AmericanSpanish American IndianSri LankanSubsaharan AfricanSudaneseSwedishSwissSyrianTaiwaneseThaiTlingit-HaidaTohono O'OdhamTonganTrinidadian and TobagonianTsimshianTurkishU.S. Virgin IslanderUkrainianUruguayanUteVenezuelanVietnameseWelshWest IndianYakamaYaquiYugoslavianYumanYup'ikZimbabwean
Immigration
NonimmigrantsImmigrantsAfghanistanAfricaAlbaniaArgentinaArmeniaAsiaAustraliaAustriaBahamasBangladeshBarbadosBelarusBelgiumBelizeBoliviaBosnia and HerzegovinaBrazilBulgariaBurma/MyanmarCabo VerdeCambodiaCameroonCanadaCaribbeanCentral AmericaChileChinaColombiaCongoCosta RicaCroatiaCubaCzechoslovakiaDenmarkDominicaDominican RepublicEastern AfricaEastern AsiaEastern EuropeEcuadorEgyptEl SalvadorEnglandEritreaEthiopiaEuropeFijiFranceGermanyGhanaGreeceGrenadaGuatemalaGuyanaHaitiHondurasHong KongHungaryIndiaIndonesiaIranIraqIrelandIsraelItalyJamaicaJapanJordanKazakhstanKenyaKoreaKuwaitLaosLatin AmericaLatviaLebanonLiberiaLithuaniaMalaysiaMexicoMicronesiaMiddle AfricaMoldovaMoroccoNepalNetherlandsNicaraguaNigeriaNorth AmericaNorth MacedoniaNorthern AfricaNorthern EuropeNorwayOceaniaPakistanPanamaPeruPhilippinesPolandPortugalRomaniaRussiaSaudi ArabiaScotlandSenegalSerbiaSierra LeoneSingaporeSomaliaSouth AfricaSouth AmericaSouth Central AsiaSouth Eastern AsiaSouthern EuropeSpainSri LankaSt. Vincent and the GrenadinesSudanSwedenSwitzerlandSyriaTaiwanThailandTrinidad and TobagoTurkeyUgandaUkraineUruguayUzbekistanVenezuelaVietnamWest IndiesWestern AfricaWestern AsiaWestern EuropeYemenZaireZimbabweAzores
Ugandan
Race
Ancestry
AfghanAfricanAlaska NativeAlaskan AthabascanAlbanianAleutAlsatianAmericanApacheArabArapahoArgentineanArmenianAssyrian/Chaldean/SyriacAustralianAustrianBahamianBangladeshiBarbadianBasqueBelgianBelizeanBermudanBhutaneseBlackfeetBolivianBrazilianBritishBritish West IndianBulgarianBurmeseCajunCambodianCanadianCape VerdeanCarpatho RusynCelticCentral AmericanCentral American IndianCherokeeCheyenneChickasawChileanChineseChippewaChoctawColombianColvilleComancheCosta RicanCreeCreekCroatianCrowCubanCypriotCzechCzechoslovakianDanishDelawareDominicanDutchDutch West IndianEastern EuropeanEcuadorianEgyptianEnglishEstonianEthiopianEuropeanFijianFilipinoFinnishFrenchFrench American IndianFrench CanadianGermanGerman RussianGhanaianGreekGuamanian/ChamorroGuatemalanGuyaneseHaitianHmongHonduranHopiHoumaHungarianIcelanderIndian (Asian)IndonesianInupiatIranianIraqiIrishIroquoisIsraeliItalianJamaicanJapaneseJordanianKenyanKiowaKoreanLaotianLatvianLebaneseLiberianLithuanianLumbeeLuxembourgerMacedonianMalaysianMalteseMarshalleseMenomineeMexicanMexican American IndianMongolianMoroccanNative HawaiianNavajoNepaleseNew ZealanderNicaraguanNigerianNorthern EuropeanNorwegianOkinawanOsageOttawaPaiutePakistaniPalestinianPanamanianParaguayanPennsylvania GermanPeruvianPimaPolishPortuguesePotawatomiPuebloPuerto RicanPuget Sound SalishRomanianRussianSalvadoranSamoanScandinavianScotch-IrishScottishSeminoleSenegaleseSerbianShoshoneSierra LeoneanSiouxSlavicSlovakSloveneSomaliSouth AfricanSouth AmericanSouth American IndianSoviet UnionSpaniardSpanishSpanish AmericanSpanish American IndianSri LankanSubsaharan AfricanSudaneseSwedishSwissSyrianTaiwaneseThaiTlingit-HaidaTohono O'OdhamTonganTrinidadian and TobagonianTsimshianTurkishU.S. Virgin IslanderUgandanUkrainianUruguayanUteVenezuelanVietnameseWelshWest IndianYakamaYaquiYugoslavianYumanYup'ikZimbabwean
Immigration
NonimmigrantsImmigrantsAfghanistanAfricaAlbaniaArgentinaArmeniaAsiaAustraliaAustriaBahamasBangladeshBarbadosBelarusBelgiumBelizeBoliviaBosnia and HerzegovinaBrazilBulgariaBurma/MyanmarCabo VerdeCambodiaCameroonCanadaCaribbeanCentral AmericaChileChinaColombiaCongoCosta RicaCroatiaCubaCzechoslovakiaDenmarkDominicaDominican RepublicEastern AfricaEastern AsiaEastern EuropeEcuadorEgyptEl SalvadorEnglandEritreaEthiopiaEuropeFijiFranceGermanyGhanaGreeceGrenadaGuatemalaGuyanaHaitiHondurasHong KongHungaryIndiaIndonesiaIranIraqIrelandIsraelItalyJamaicaJapanJordanKazakhstanKenyaKoreaKuwaitLaosLatin AmericaLatviaLebanonLiberiaLithuaniaMalaysiaMexicoMicronesiaMiddle AfricaMoldovaMoroccoNepalNetherlandsNicaraguaNigeriaNorth AmericaNorth MacedoniaNorthern AfricaNorthern EuropeNorwayOceaniaPakistanPanamaPeruPhilippinesPolandPortugalRomaniaRussiaSaudi ArabiaScotlandSenegalSerbiaSierra LeoneSingaporeSomaliaSouth AfricaSouth AmericaSouth Central AsiaSouth Eastern AsiaSouthern EuropeSpainSri LankaSudanSwedenSwitzerlandSyriaTaiwanThailandTrinidad and TobagoTurkeyUgandaUkraineUruguayUzbekistanVenezuelaVietnamWest IndiesWestern AfricaWestern AsiaWestern EuropeYemenZaireZimbabweAzores
Family Households with Children
Income
Poverty
Unemployment
Labor Participation
Family Structure
Vehicle Availability
Education Level
Disability

Family Households with Children Comparison

Immigrants from St. Vincent and the Grenadines

Ugandans

Tragic
Average
25.6%
FAMILY HOUSEHOLDS WITH CHILDREN
0.0/ 100
METRIC RATING
339th/ 347
METRIC RANK
27.4%
FAMILY HOUSEHOLDS WITH CHILDREN
49.2/ 100
METRIC RATING
177th/ 347
METRIC RANK

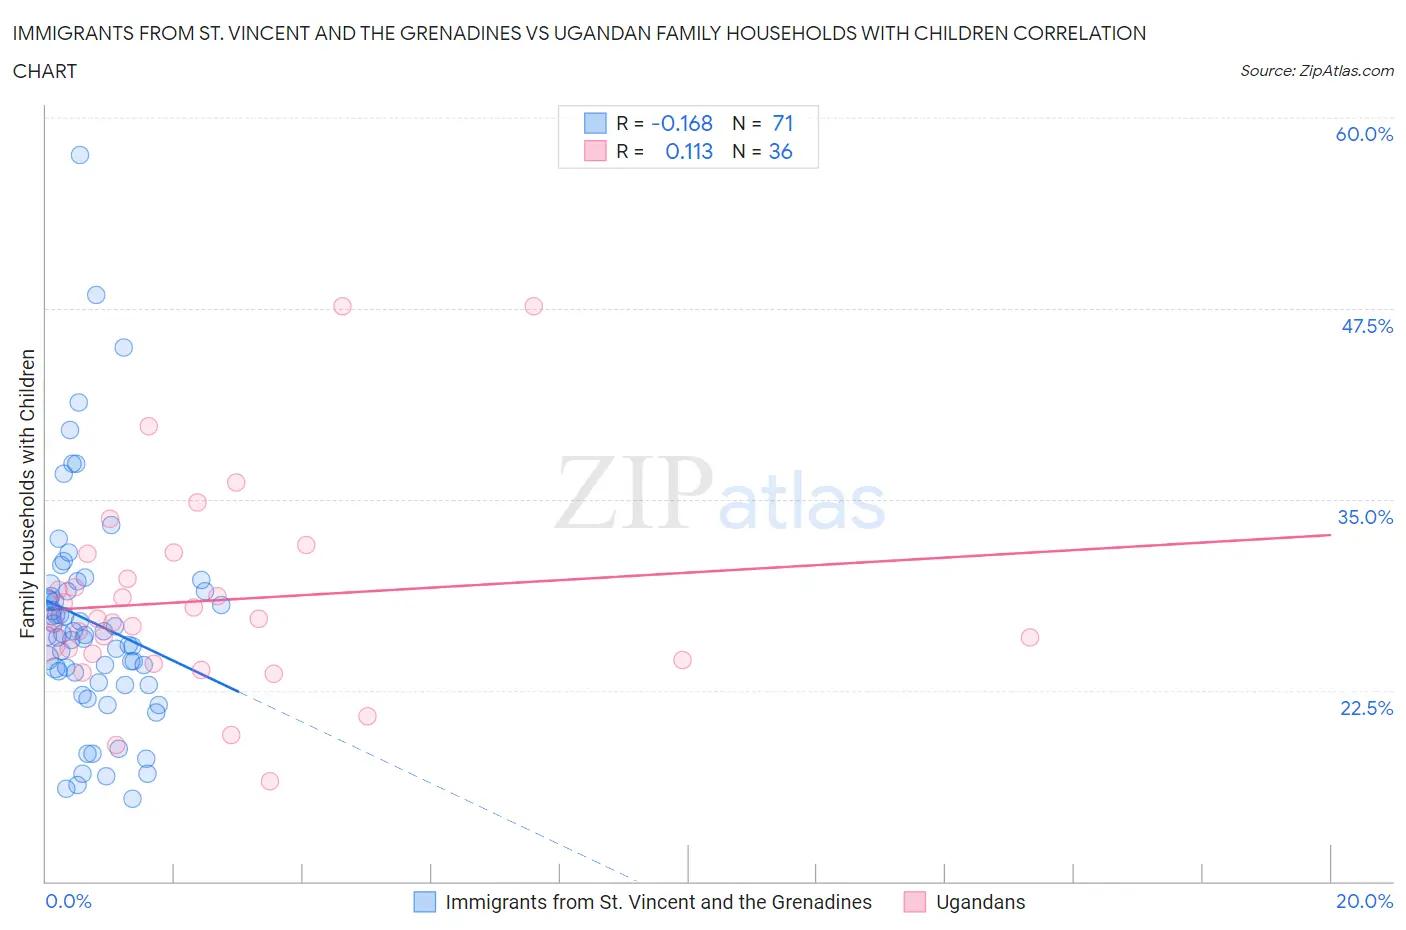
Immigrants from St. Vincent and the Grenadines vs Ugandan Family Households with Children Correlation Chart

The statistical analysis conducted on geographies consisting of 56,180,782 people shows a poor negative correlation between the proportion of Immigrants from St. Vincent and the Grenadines and percentage of family households with children in the United States with a correlation coefficient (R) of -0.168 and weighted average of 25.6%. Similarly, the statistical analysis conducted on geographies consisting of 93,993,745 people shows a poor positive correlation between the proportion of Ugandans and percentage of family households with children in the United States with a correlation coefficient (R) of 0.113 and weighted average of 27.4%, a difference of 7.3%.
Immigrants from St. Vincent and the Grenadines vs Ugandan Family Households with Children

Family Households with Children Correlation Summary

MeasurementImmigrants from St. Vincent and the GrenadinesUgandan
Minimum15.4%16.6%
Maximum57.6%47.7%
Range42.2%31.1%
Mean27.0%28.4%
Median26.1%27.1%
Interquartile 25% (IQ1)23.0%24.7%
Interquartile 75% (IQ3)29.0%30.6%
Interquartile Range (IQR)6.0%5.9%
Standard Deviation (Sample)7.4%6.7%
Standard Deviation (Population)7.3%6.6%

Similar Demographics by Family Households with Children

Demographics Similar to Immigrants from St. Vincent and the Grenadines by Family Households with Children

In terms of family households with children, the demographic groups most similar to Immigrants from St. Vincent and the Grenadines are Arapaho (25.6%, a difference of 0.010%), Puerto Rican (25.6%, a difference of 0.040%), Immigrants from Armenia (25.6%, a difference of 0.040%), Immigrants from Serbia (25.5%, a difference of 0.42%), and Immigrants from West Indies (25.7%, a difference of 0.43%).
DemographicsRating | RankFamily Households with Children
Immigrants | Austria
0.0
/100
|
#332
Tragic
25.8%
Immigrants | Switzerland
0.0
/100
|
#333
Tragic
25.7%
Slovaks
0.0
/100
|
#334
Tragic
25.7%
Immigrants | Croatia
0.0
/100
|
#335
Tragic
25.7%
Immigrants | West Indies
0.0
/100
|
#336
Tragic
25.7%
Puerto Ricans
0.0
/100
|
#337
Tragic
25.6%
Arapaho
0.0
/100
|
#338
Tragic
25.6%
Immigrants | St. Vincent and the Grenadines
0.0
/100
|
#339
Tragic
25.6%
Immigrants | Armenia
0.0
/100
|
#340
Tragic
25.6%
Immigrants | Serbia
0.0
/100
|
#341
Tragic
25.5%
Alsatians
0.0
/100
|
#342
Tragic
25.3%
Hopi
0.0
/100
|
#343
Tragic
25.2%
Pueblo
0.0
/100
|
#344
Tragic
25.2%
Immigrants | Grenada
0.0
/100
|
#345
Tragic
25.2%
Carpatho Rusyns
0.0
/100
|
#346
Tragic
25.2%

Demographics Similar to Ugandans by Family Households with Children

In terms of family households with children, the demographic groups most similar to Ugandans are Immigrants from China (27.4%, a difference of 0.010%), Spanish American (27.4%, a difference of 0.010%), White/Caucasian (27.4%, a difference of 0.020%), British (27.4%, a difference of 0.020%), and Turkish (27.4%, a difference of 0.050%).
DemographicsRating | RankFamily Households with Children
Cherokee
56.7
/100
|
#170
Average
27.5%
Blackfeet
54.3
/100
|
#171
Average
27.5%
Israelis
53.9
/100
|
#172
Average
27.5%
Immigrants | Argentina
52.2
/100
|
#173
Average
27.5%
Whites/Caucasians
50.0
/100
|
#174
Average
27.4%
British
49.9
/100
|
#175
Average
27.4%
Immigrants | China
49.6
/100
|
#176
Average
27.4%
Ugandans
49.2
/100
|
#177
Average
27.4%
Spanish Americans
48.9
/100
|
#178
Average
27.4%
Turks
46.9
/100
|
#179
Average
27.4%
Immigrants | Turkey
46.9
/100
|
#180
Average
27.4%
Aleuts
46.7
/100
|
#181
Average
27.4%
Puget Sound Salish
46.2
/100
|
#182
Average
27.4%
South Africans
44.9
/100
|
#183
Average
27.4%
Native Hawaiians
44.6
/100
|
#184
Average
27.4%